
This is a web page version of a report from Living Streets, which is also published as a pdf document. This version has been adapted to focus on providing accessibility for people who want to enlarge the text or to use a screen reader.
The key information below is taken from the document cover pages:
Document title: Inclusive design at continuous footways, Appendix 1 (Detailed study sites)
Document date & version: October 2023, Version 1.6.2
Publishing organisation: Living Streets
Author/research lead: Robert Weetman
Ten junctions were chosen for much more detailed study, referred to as “detailed-study sites”.
Our chosen detailed-study sites were as shown in Table 1:
In this web page version of the report Table 1 from the original document has been converted into a list. Each item in the list provides a unique site reference code, the name of the city, the name we gave the detailed-study site, a link to Google Streetview, and a link to a map at www.openstreetmap.org.
CF-487, Cardiff, Glamorgan St at Cowbridge Rd East, https://goo.gl/maps/MsY2gf6zUc55JGWa8 Openstreetmap.org link
CF-72, Edinburgh, Simpson Loan at Chalmers Street, https://goo.gl/maps/Kvtyvniyke3PPzhz7 Openstreetmap.org link
CF-93, Glasgow, Sauchiehall Lane east of Holland St, https://goo.gl/maps/152diyU2SdCm1nB9A Openstreetmap.org link
CF-102, Glasgow, Scott Street at Sauchiehall Street, https://goo.gl/maps/nZTTvG18V8g3K1xL6 Openstreetmap.org link
CF-85, Glasgow, Drury Street at Renfield Street, https://goo.gl/maps/KmHduiH4echaqUzR7 Openstreetmap.org link
CF-2, Leeds, Kirkstall Road Haddon Road, https://goo.gl/maps/9a1LiDPNe4CmXFjz5 Openstreetmap.org link
CF-366, Leeds, Kirkstall Road Woodside Avenue, https://goo.gl/maps/ipPznRtuYhqYcLAx6 Openstreetmap.org link
CF-1, London, Lansdowne Terrace at Guilford Street, https://goo.gl/maps/ZwasTTsK4hu4gUp87 Openstreetmap.org link
CF-228, London, Wilfred Street at Buckingham Gate, https://goo.gl/maps/XWWDUPAH7LRvvA748 Openstreetmap.org link
CF-394, London, Alderney Road at Bancroft Road, https://goo.gl/maps/cPkqNenXXLQfyPaYA Openstreetmap.org link
The experiences of individual pedestrians were recorded (“pedestrian experiences”), by viewing footage from fixed cameras, based on whether these were free of any major interactions with vehicles, or whether they should be flagged against three possible measures. These measures are summarised below in Table 2 (full details are provided in the main report).
In this webpage version of the report, Table 2 has been replaced with the descriptive text below.
Measure ”RLA” flags any actual observed interactions where there appeared to be reasons to record that pedestrians were more at risk or that they had reason to be more concerned by the interaction.
Measure code prA means “moderate” issues.
Measure code drA means “higher” risk issues
Measure “PVI” asks for a broad prediction of the worst possible outcome for a blind or partially sighted pedestrian who assumed they had priority so did not check for vehicles, based on the assumption that the driver observed in the footage behaved exactly as seen in the footage (without any additional changes to their behaviour as a risk of collision became apparent). Note that overall PVI provides a numerical measure of junction conditions not actual predictions.
Measure code “prA” means “moderate” issues
Measure code “drA” means “higher” risk issues
Measure code “HbC” means “hit by car”
Measure code “HbL” means “hit by larger”
Measure code “HBl” means “hit by bicycle likely”
Measure code “HBr” means “hit by bicycle risk”
Measure code “TdMB” means “touching distance moving bicycle”
Measure code “TdMC” means “touching distance moving car”
Measure code “TdML” means “touching distance moving larger”
Measure code “WiMC” means “walk into moving car”
Measure code “WiML” means “walk into moving larger”
Measure code “WiSC” means “walk into stationary car”
Measure code “WiSL” means “walk into stationary larger”
Measure “OPD” Records actual observations of drivers behaving politely by giving way with plenty of time, and/or showing obvious patience towards an individual pedestrian (not drivers giving way reluctantly or being forced to do so).
Measure code “Hg” means “holds leaving gap”
Measure code “Hm” means “holds moving”
Measure code “HJc” means “holds just clear”
Measure code “HVc” means “holds very clear”
NB: These measures are attempts to record, as objectively as possible, whether pedestrians are prioritised – in order to provide a tool by which different designs can be compared. Experiences flagged according to the RLA measure are not necessarily “risky” in any wider sense and “higher” risk pedestrian experiences are not necessarily “high-risk” in any more objective sense. Similarly, the PVI measure makes assumptions about behaviour which are unreasonable in the real world – in order to provide a relatively objective measure of the performance of the junction. Thus the PVI measure is not an actual prediction of what would have happened to a blind or partially sighted pedestrian. For more details, refer to the main report.
Figure 1 below shows the percentage of pedestrian experiences flagged according to the RLA measure, plotted against the number of vehicles crossing the drivable space.
Broadly it can be seen the number of experiences flagged according to the RLA measure are simply a product of the number of vehicles crossing the drivable space.
Figure 2 below shows the percentage of pedestrian experiences flagged according to the PVI measure, plotted against the number of vehicles crossing the drivable space.
Broadly it can be seen the number of experiences flagged according to the PVI measure are simply a product of the number of vehicles crossing the drivable space.
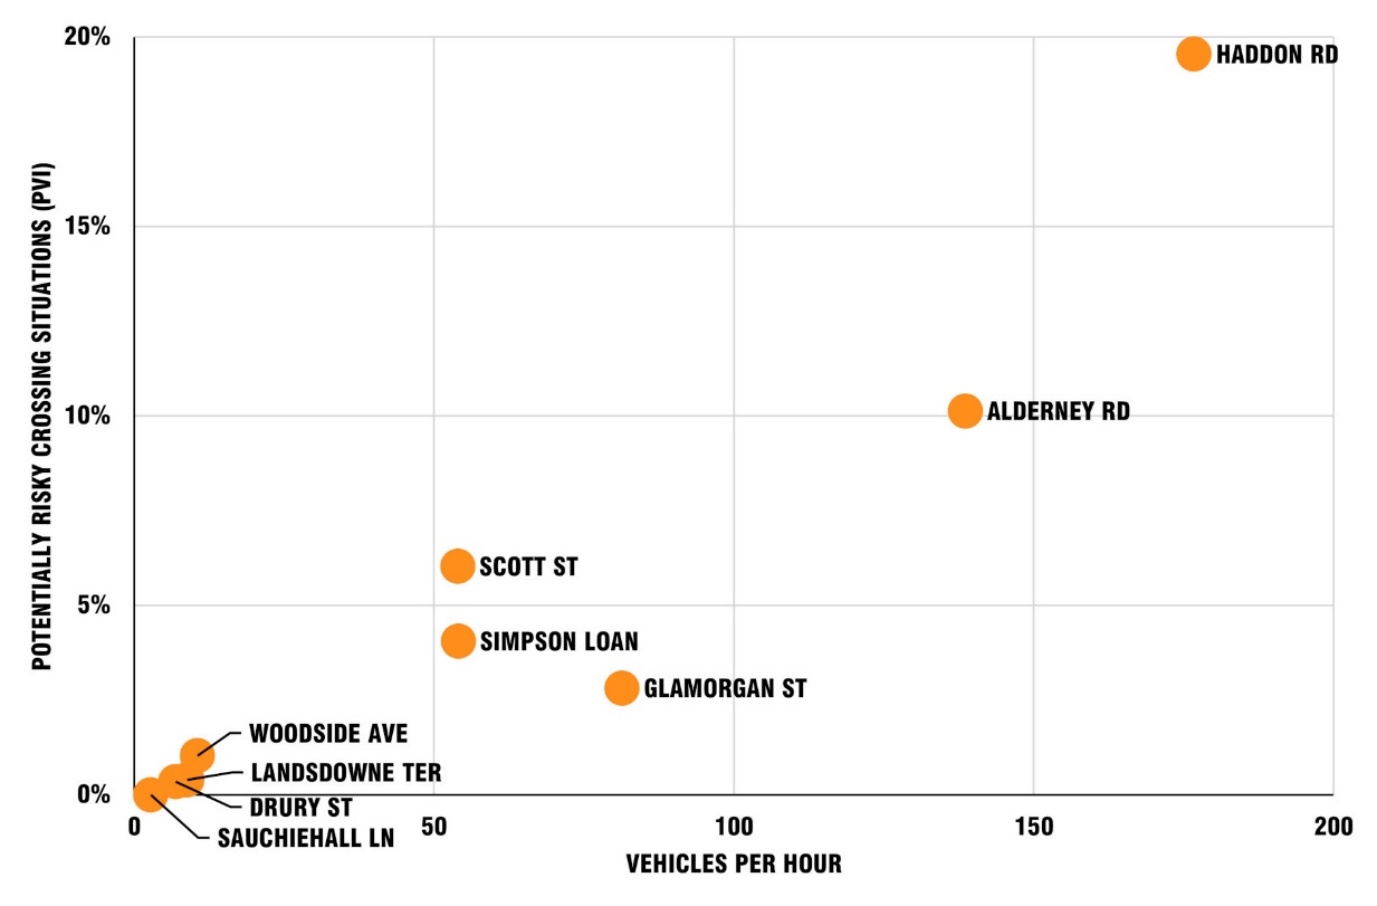
Figure 3 below shows the percentage of pedestrian experiences flagged according to the OPD measure, plotted against the number of vehicles crossing the drivable space.
As with the measures above, broadly it can be seen these are simply a product of the number of vehicles crossing the drivable space.

Figure 4 below shows the percentage of pedestrian experiences flagged according to the RLA measure for each site – broken down to show the balance between “moderate” and “higher” level problems.
The balance between experiences flagged as meeting “higher” or “moderate” level conditions is of interest in comparing conditions at different sites.
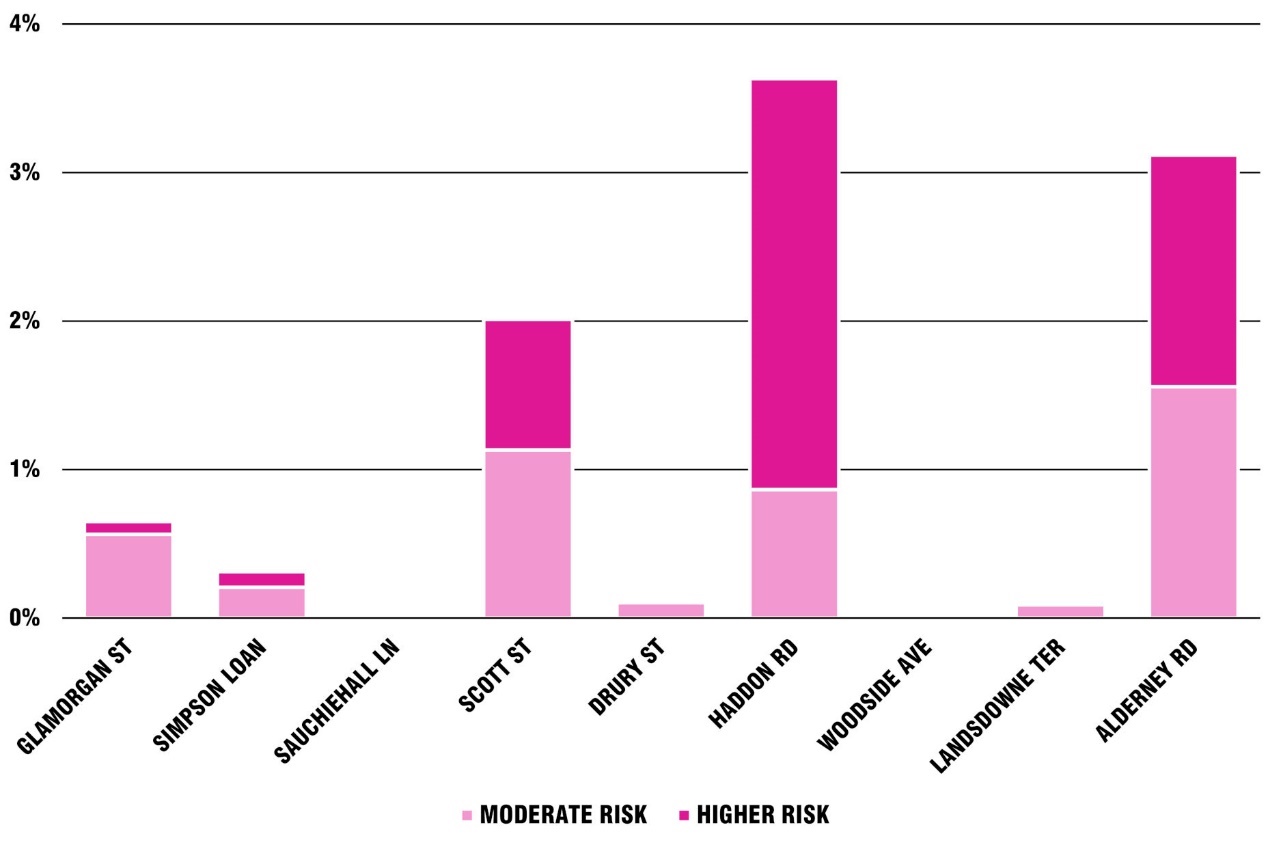
Figure 5 below shows the percentage of pedestrian experiences flagged according to the PVI measure, listed by site.
As shown above, sites flagged more frequently in this respect are generally those with more vehicles crossing the drivable area.
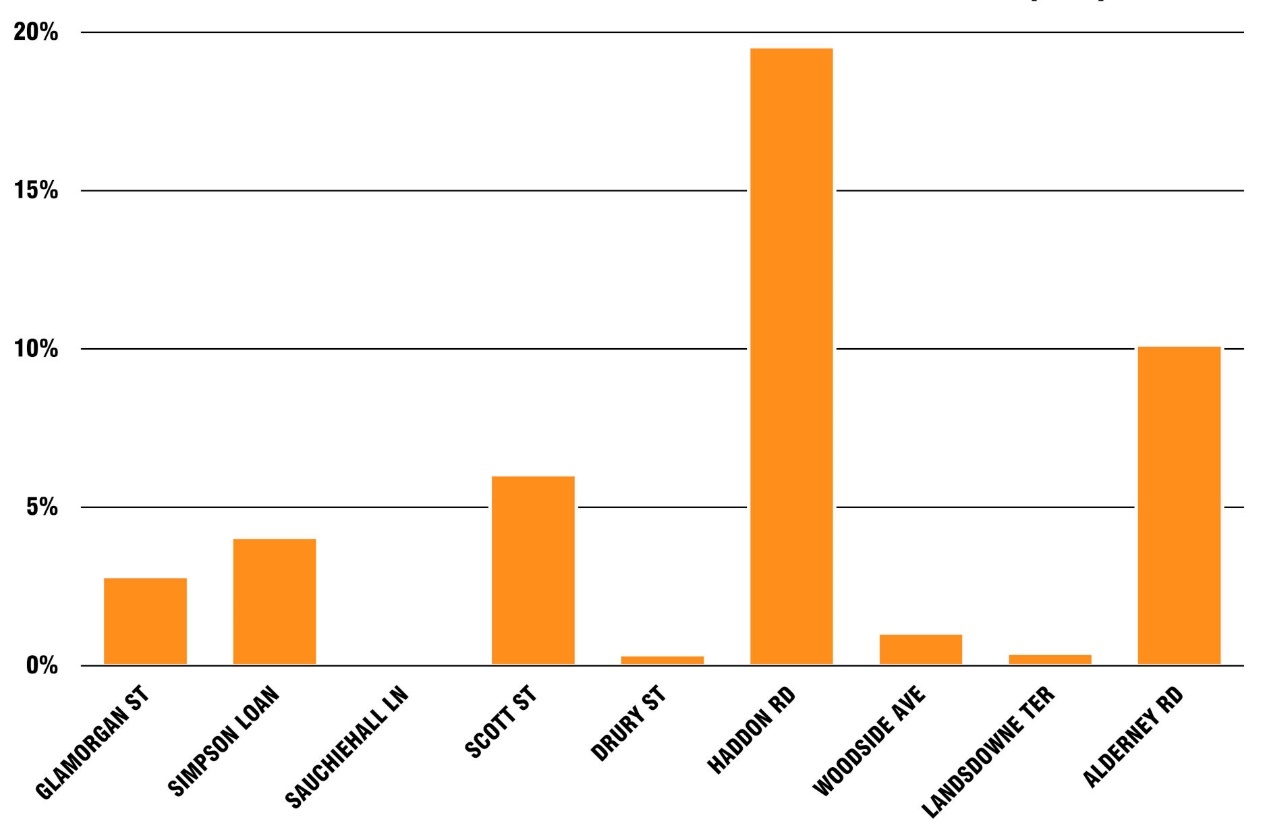
Figure 6 shows the percentage of pedestrian experiences flagged as including “observable polite driving”, listed by site.
Sites with a higher percentage of polite driving are generally those with a higher number of drivers crossing.
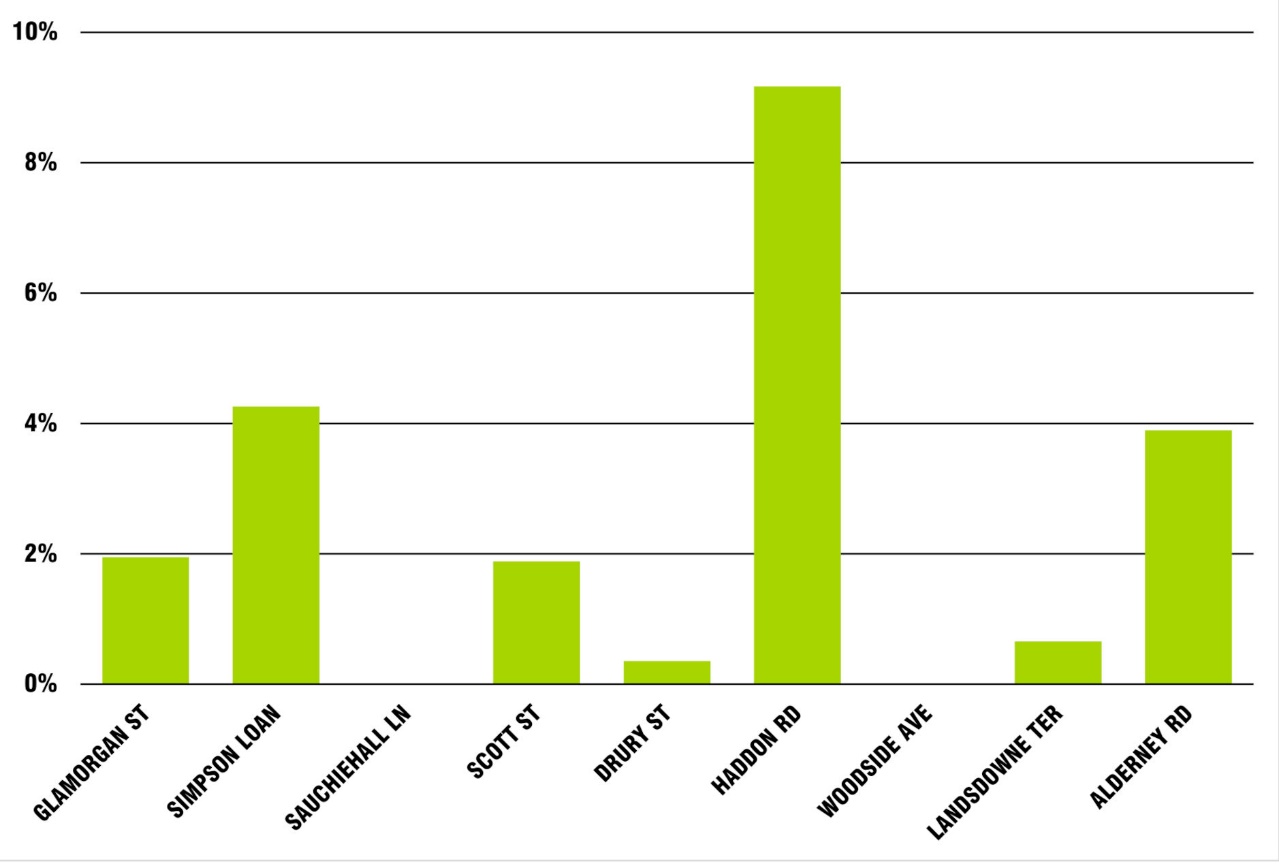
Figure 7 below compares the number of pedestrians and vehicles crossing the drivable space, broken down to show the maximum and minimum numbers observed in any hourly period (in our study period of 07:00-19:00 hours).
Note that for Lansdowne terrace, a very high proportion of the “vehicles” crossing the drivable space were bicycles and in some of our comparisons we have accounted for this separately.
The balance between pedestrian and vehicle numbers is relevant in comparing sites, but note that the highest and lowest pedestrian numbers did not necessarily occur in the same hours as the highest and lowest vehicle numbers.
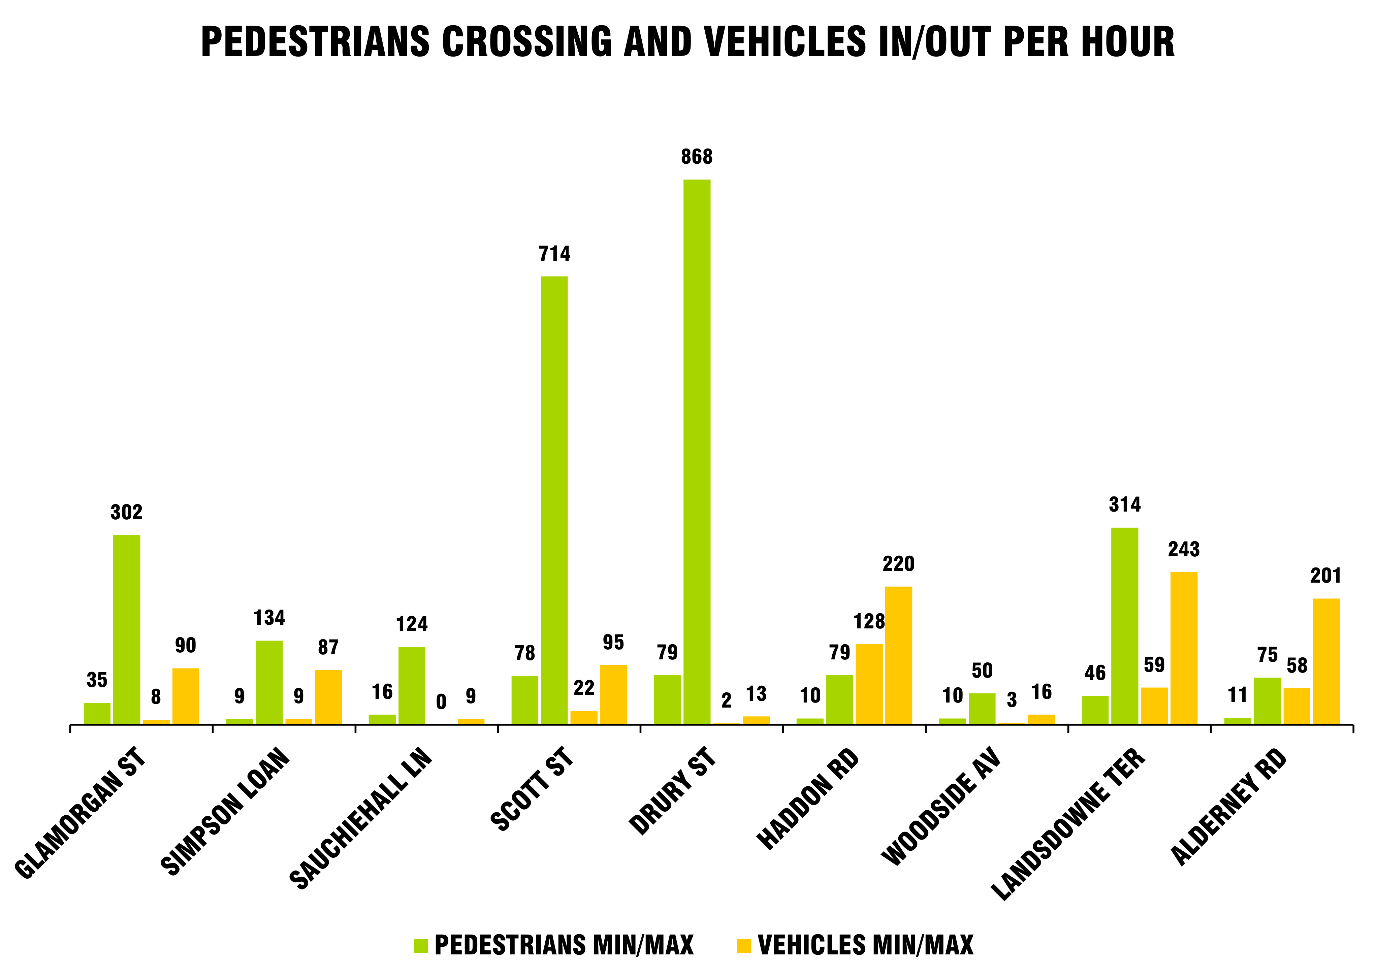
Table 3 provides a comparison of sites according to some key factors (providing a simplified account based on an informal subjective analysis for this purpose).

Notes
1 Lansdowne Terrace - motor vehicles are rare, but bicycles are common
2 Drury Street - main restrictions on width are after crossing the footway
3 Woodside Avenue – vehicles may need to slow on exit because of sudden change in incline of street
4 Scott Street – there is clear contrast, but multiple changes in colour of materials mean footway, carriageway and cycle track all change colour at least once (some several times)
(at junction with Sauchiehall Street)
(3D model includes data © Crown copyright 2023, OS 100046668)
Looking toward side road (driver’s view)

Looking toward side road (pedestrian view)

Lack of ramp at edge of main carriageway

Tactile paving detail (looking toward side road)


Background mapping © Crown copyright 2023, OS 100046668
This location is in the centre of Glasgow. The Sauchiehall Lane site is also nearby. Sauchiehall Street is lined with shops, restaurants, and other properties and is a central shopping/entertainment street. Scott Street has a steep incline upwards away from the junction.
Vehicle movement on the main carriageway is one-way, in two lanes – although parked vehicles tend to narrow the flow of vehicles to one lane’s worth, with effectively a slalom course emerging between these. There is a two-way cycle track, which is at footway height (separated from the footway by a slightly raised white strip). Vehicle movement on the side road is one-way away from the junction.
Surface colours are complex, with multiple changes of colour and texture. The cycle track has three different colours, and a colour at the drivable space which is the same as for the footway/drivable space. The main carriageway changes colour at the junction. There is a particularly large drivable area, surfaced with blocks (in comparison to larger slab-size material on the normal footway, but of the same colour as the footway). The edges of this are marked with double-yellow lines.
There is no ramp between the carriageway surfaces and the drivable space. Unusually there is a ramp in Sauchiehall Street, bringing the main carriageway to footway height.
In comparison to other study sites there were very high levels of pedestrian use (78-714 crossing per hour within the hours of 07:00-19:00), and moderate traffic levels.
There are numerous areas/strips of tactile paving, with blister-style paving marking the edges of what would previously have been the carriageway of Scott Street, blister-style paving marking designated crossing points of the cycle track and of Sauchiehall Street, and corduroy paving alongside the edge of the area intended for cycling at the junction.
Many vehicles pass over the ramp in Sauchiehall Street (the main carriageway) without noticeably slowing.
Because vehicles can turn into Scott Street with a wide sweeping level path, over the non-footway and drivable space areas (there is no definition between these), almost all drivers did this (maintaining some speed). The steep hill of Scott Street (upwards) may influence driver behaviours on approach.
It was noticeable that pedestrians often behave as if this is a standard side road, lining up along the edges of the space that might have been the carriageway of Scott Street to wait for vehicles to pass before crossing.
NB: Artificial intelligence identification of vehicle types includes errors. Individual lines may be misleading.
Drivers (red) can be seen to take wide sweeping paths across the drivable space.
Cyclists (blue) can be seen almost all to be on the cycle track.
While pedestrians (yellow/green) are almost all on the spaces intended, there is a significant degree of encroachment of pedestrians into the cycle track (walking along or standing in this).
Background image
Cars (all toward camera)

Bicycles (two way, most on cycle track)

Pedestrians

(at Holland Street)

(3D model includes data © Crown copyright 2023, OS 100046668)
Ramp

Looking toward lane, pedestrian view

Looking toward lane (driver’s view)

Looking into lane (driver’s view)

Background mapping © Crown copyright 2023, OS 100046668
A2 and A3 are footway/border widths within the lane.
This location is in the centre of Glasgow, near Sauchiehall Street (see description of Scott Street/Sauchiehall Street junction). There are many shops, cafes, pubs and similar establishments on Sauchiehall Street. Sauchiehall Lane is a tiny access lane used primarily to reach the rear of buildings (and a small amount of private car parking).
Vehicle movement on the main carriageway is one-way. Vehicle movement is allowed in both directions on Sauchiehall Lane, but this is too narrow for vehicles to pass one another.
The surface of the drivable space implies an unambiguous section of footway. The drivable area is surfaced with blocks, and the footway with slabs, but these are of a similar colour. The colour of the footway is very like the colour of the asphalt carriageway.
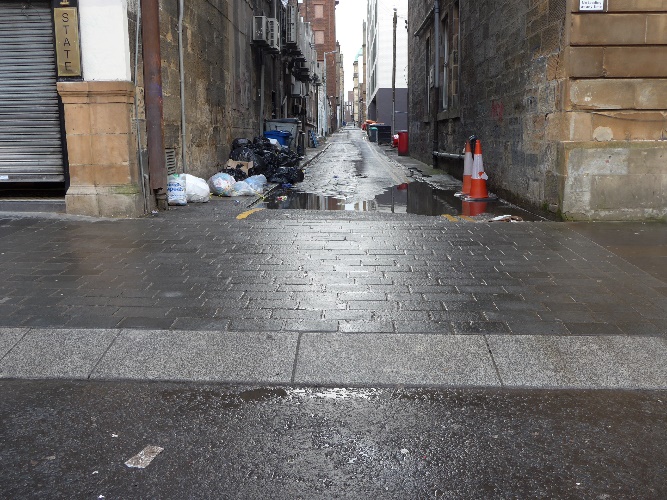
There is an unusually sharp (steep/high) ramp between the drivable space and the main carriageway. There is no ramp between this and the lane surface, but the lane surface is rough and poorly maintained, and the narrow space slows vehicles considerably.
Levels of vehicle use are very low (0-9 crossing per hour between the hours of 07:00-19:00). Pedestrian use is moderate (16-124 per hour between the hours of 07:00-19:00).
There is no tactile paving here. The ramp is probably detectable with a long cane, by touch (with feet), or by a guide dog as marking the edge of the footway.
This is a very low-traffic lane, and vehicles moving in the lane do so very slowly. Even private cars must be driven carefully – and must be lined up before entering the actual lane. The ramp is noticeably more significant in slowing vehicles than at other study sites.


Because of the low level of traffic we observed no direct interactions between pedestrians and vehicles either while on-site or in video footage.
Pedestrians generally take little notice of the presence of the lane, although some glance into it on passing.
NB: Artificial intelligence identification of vehicle types include errors. Individual lines may be misleading.
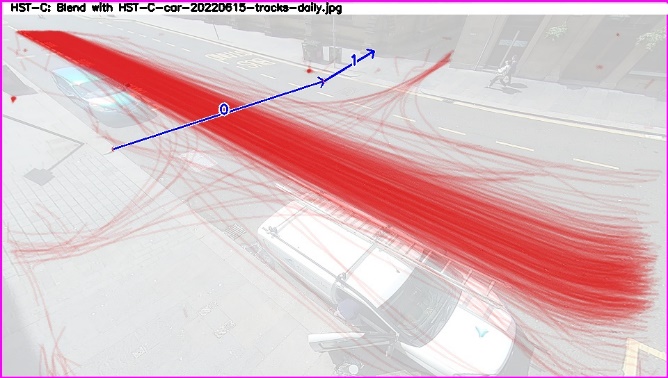
Images show little of note as regards vehicles and cycling. Drivers (red) almost all pass by on Holland Street. There are a small number of cyclists (all or almost all on the carriageway).
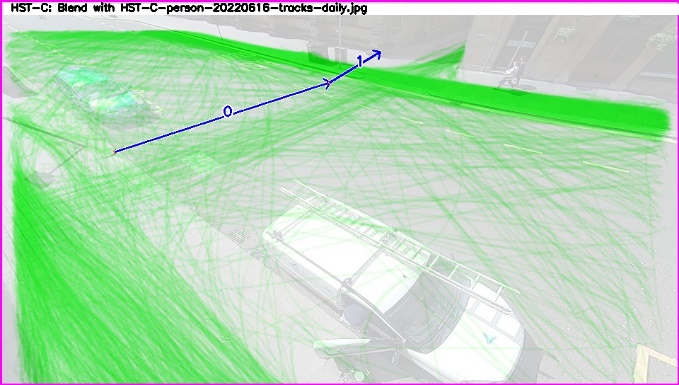
It is clear that many pedestrians (green) feel safe crossing Holland Street diagonally (i.e. without doing so directly kerb-to-kerb).
Background image

Cars (toward camera on Holland Street)
Bicycles (toward camera on Holland Street)

Pedestrians
(at junction with Renfield Street)
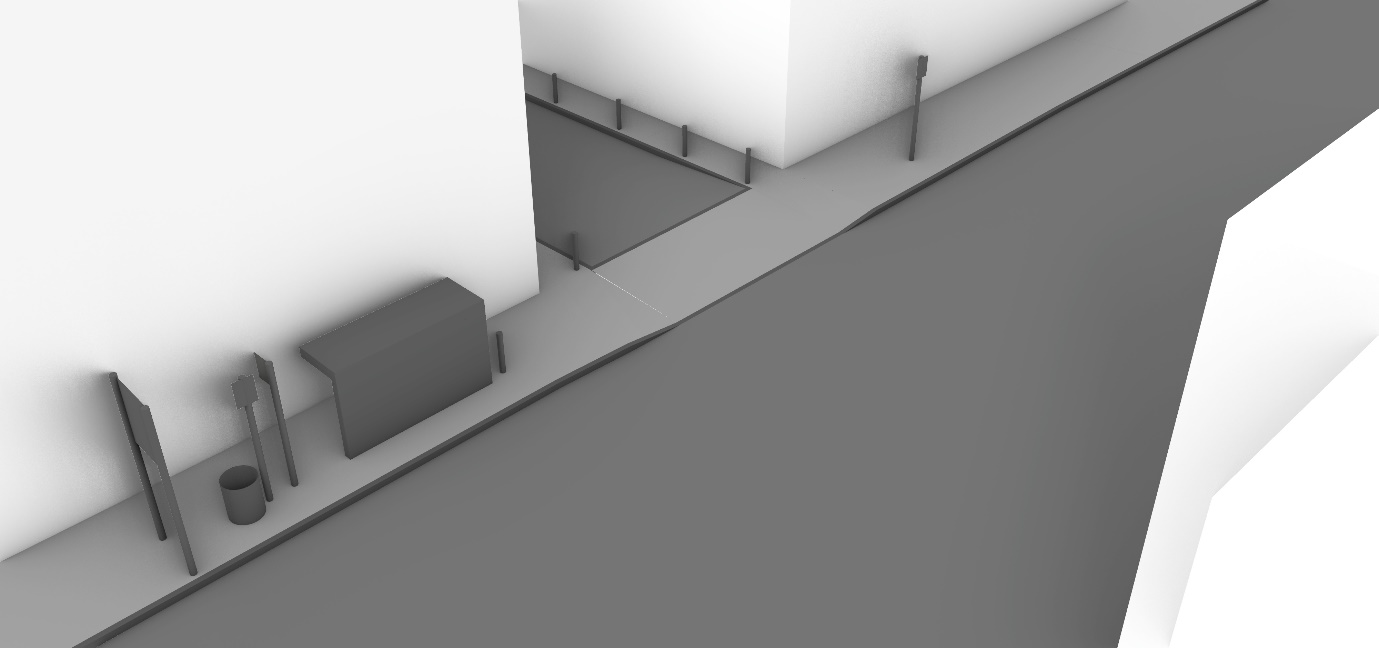
(3D model includes data © Crown copyright 2023, OS 100046668)
Looking toward lane (pedestrian view)
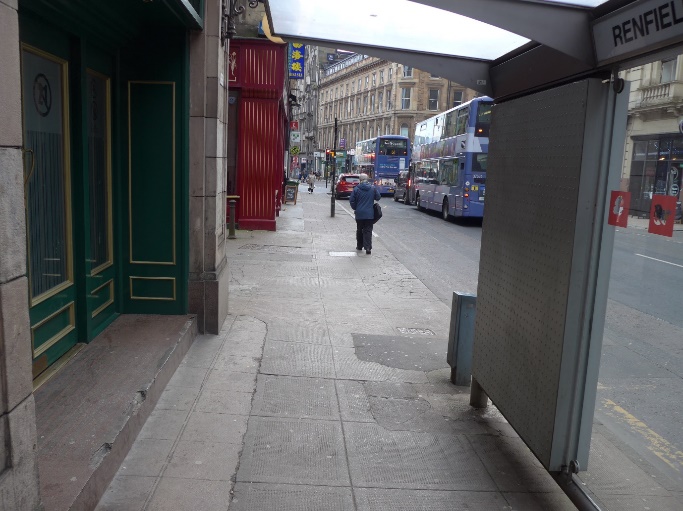
Looking toward/into lane (driver’s view)
Looking into lane (driver’s view)

Looking toward lane (pedestrian view)
Background mapping © Crown copyright 2023, OS 100046668
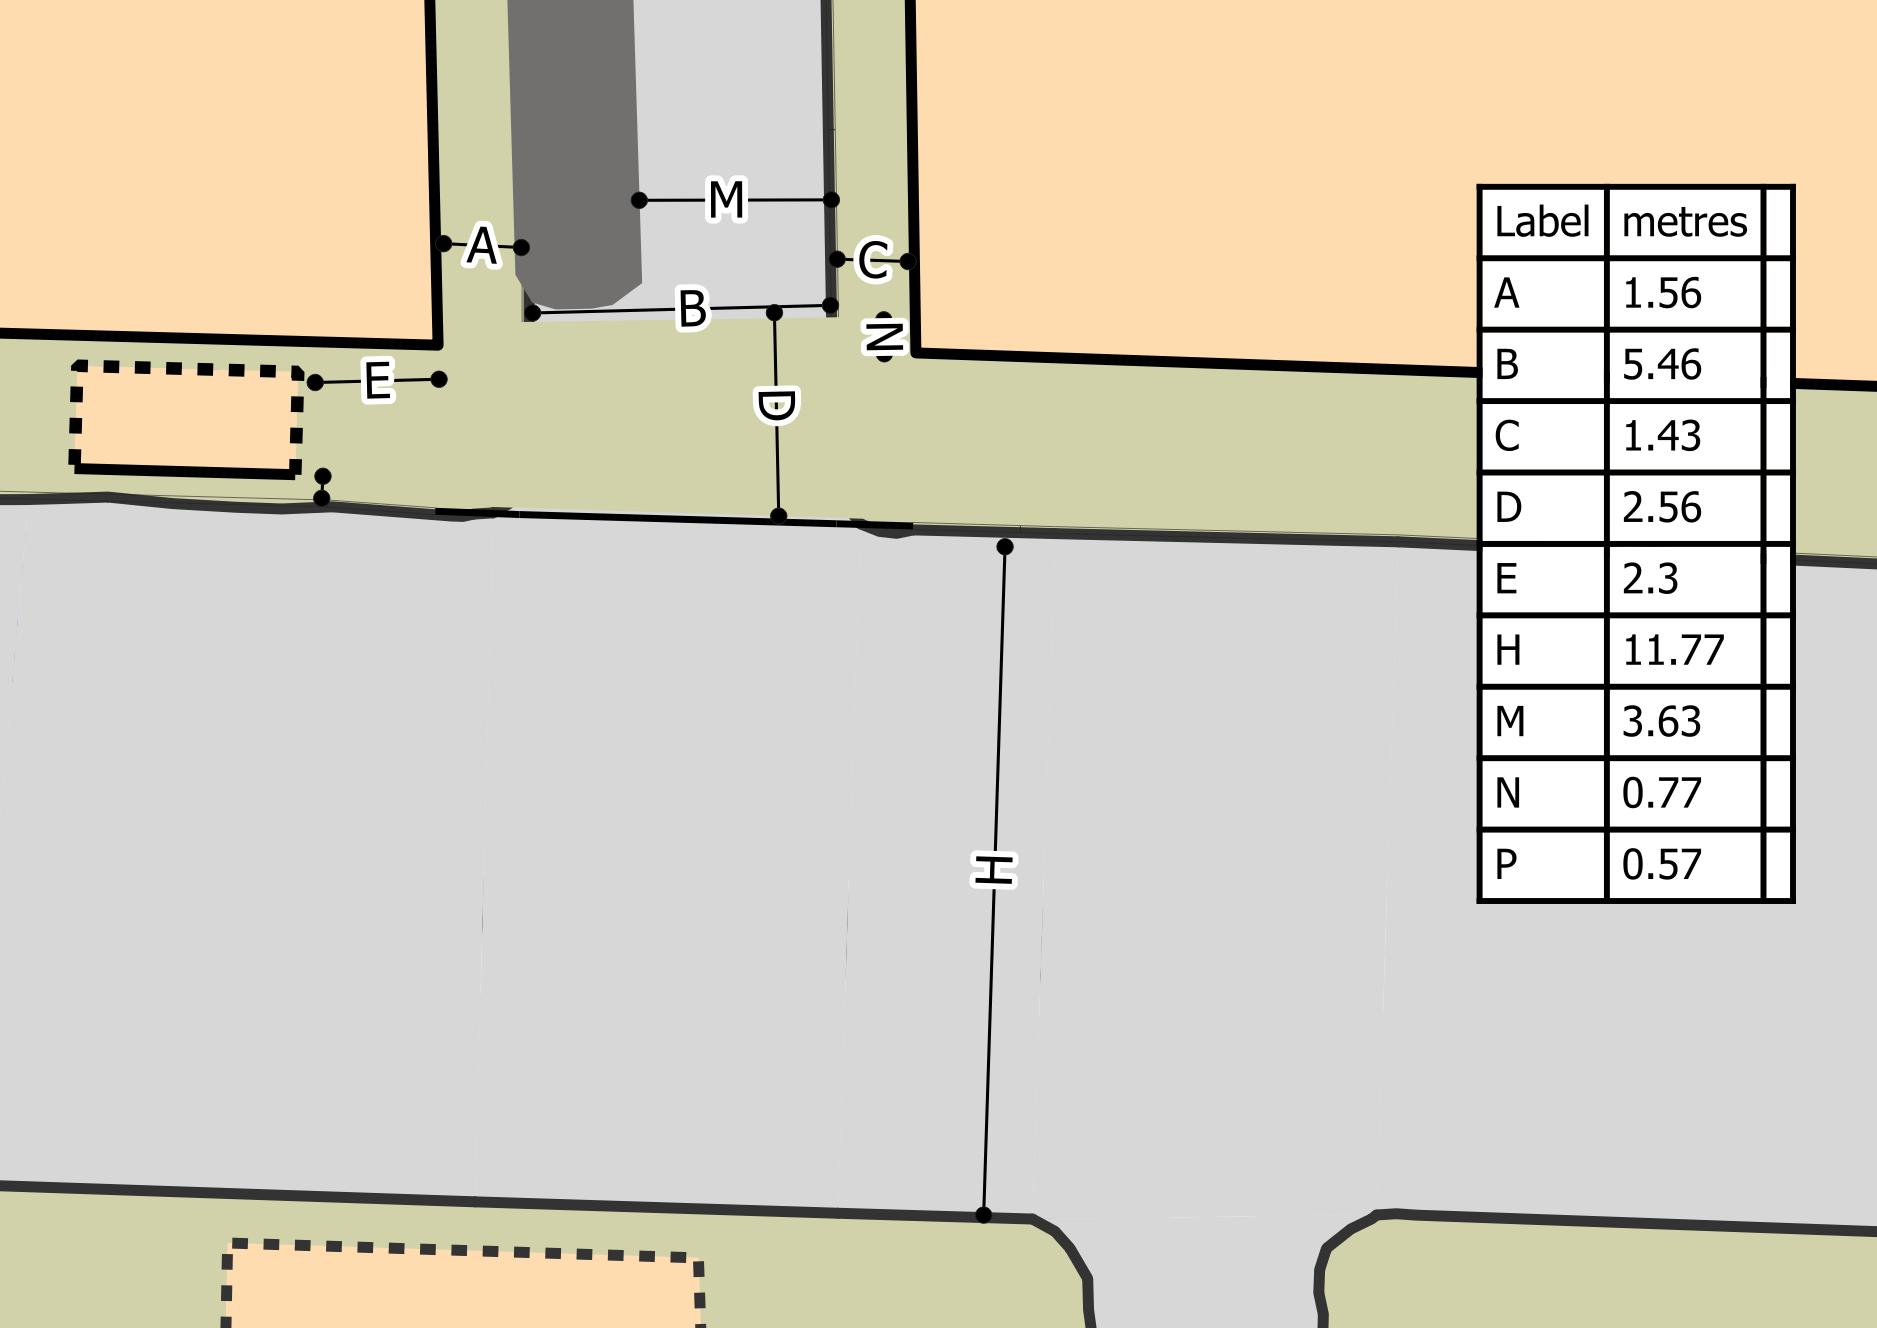
‘N’ is building line to start of lane carriageway
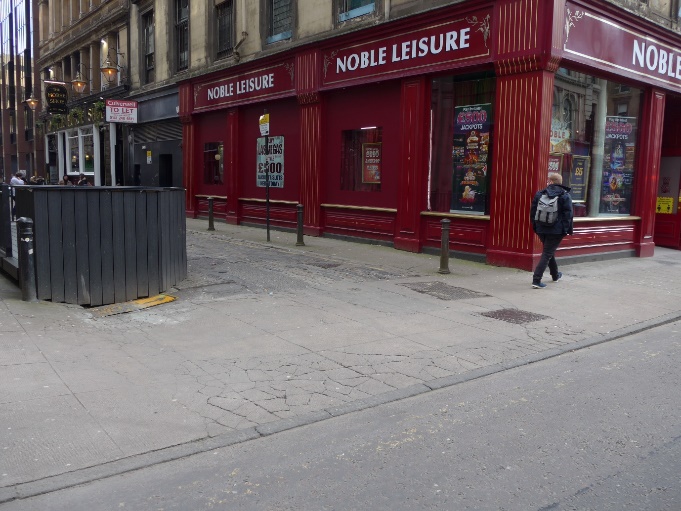
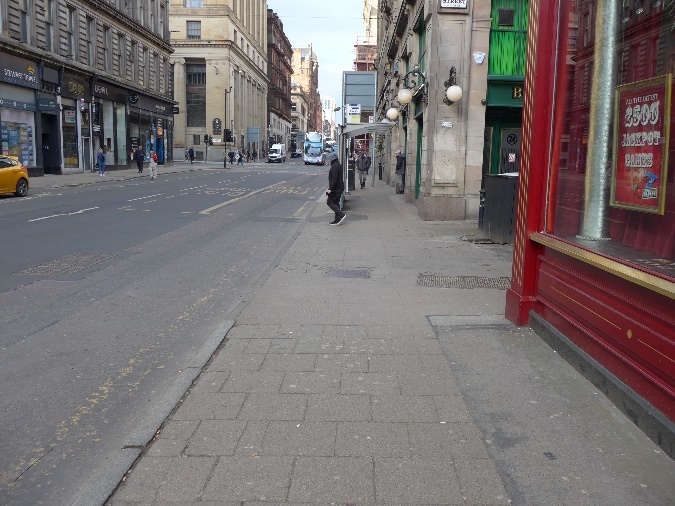
Drury Street is a narrow lane in the centre of Glasgow. Renfield Street is lined with shops, offices, and similar establishments, although it is also clear that it’s an important route for traffic (including buses). Drury Street might be described as a back lane, but there are several pubs or similar establishments on it. It is surfaced roughly with sets (i.e. “cobbles”).
Vehicle movement on both carriageways is one-way. Renfield Street is marked as if for two lanes of southbound traffic, but the carriageway also includes additional space on either side used for short-term or low levels of parking, and for a bus stop (immediately to the north of the junction).
Surface materials vary from light brown to light grey – from asphalt to concrete. While the footway is of a different colour and tone to much of the carriageway there is not a clear transition point from one to the other.
There is no ramp between the carriageway and the drivable space, giving vehicles level access into the lane.
At the time of the study there was a fenced area of seating narrowing the lane.
This was the detailed-study site with the highest number of pedestrians crossing the drivable space. There was very low use by vehicles, from around 2 to 13 in each study hour. Renfield Street feels to be very busy with vehicles, but these are often stationary – and in this area of Glasgow vehicle movement tends to be from one set of traffic signals to another nearby set of traffic signals.
For much of the observation time behaviours were defined by the high number of pedestrians crossing the drivable space. It was noticeable that most pedestrians took little notice of the presence of the lane. Those driving into the lane often encountered a situation where pedestrians were already walking across the lane entrance.
Because of the very low number of vehicles using the lane there were almost no poorer pedestrian experiences.
There appeared to be two bigger issues here. The first is the level vehicle access. In addition to this allowing faster speeds (although these were rare because of the pedestrian numbers), the lack of a more limited ramp allowed vehicle drivers to enter the drivable space in a gentle sweeping curve. This meant that some pedestrians had vehicles entering the drivable space from behind them (rather than from their side).
In contrast, there were also occasions where the width of Renfield Street, or stopped buses, meant that drivers took a wide sweeping curved path while still on Renfield Street – starting from a long way across the main carriageway – allowing more speed than might be desirable.
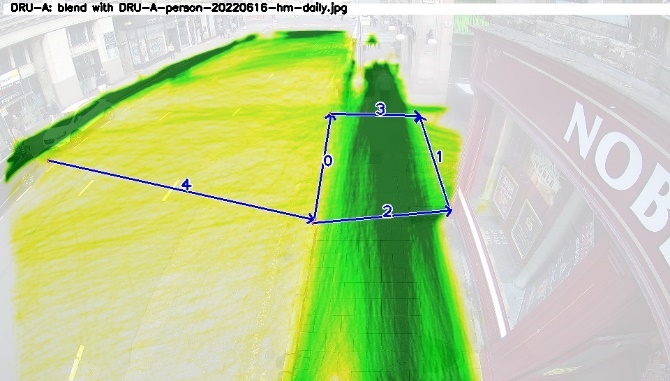
NB: Artificial intelligence identification of vehicle types include errors. Individual lines may be misleading.
Drivers (red) can be seen often to enter the lane from further out in the Renfield Street carriageway.
There were some odd cycling behaviours seen here, most noticeably by delivery cyclists. These included some on the footway, and some cycling the wrong way out of the lane. There is evidence of this in the trace image (blue). Almost all cyclists, however, can be seen to be using the carriageway.
The very high pedestrian numbers (yellow/green traces), and that their routing is mostly along the footway of Renfield Street can be seen.
Background image

Cars (all toward camera)

Bicycles

Pedestrians
(at junction with Chalmers Street)
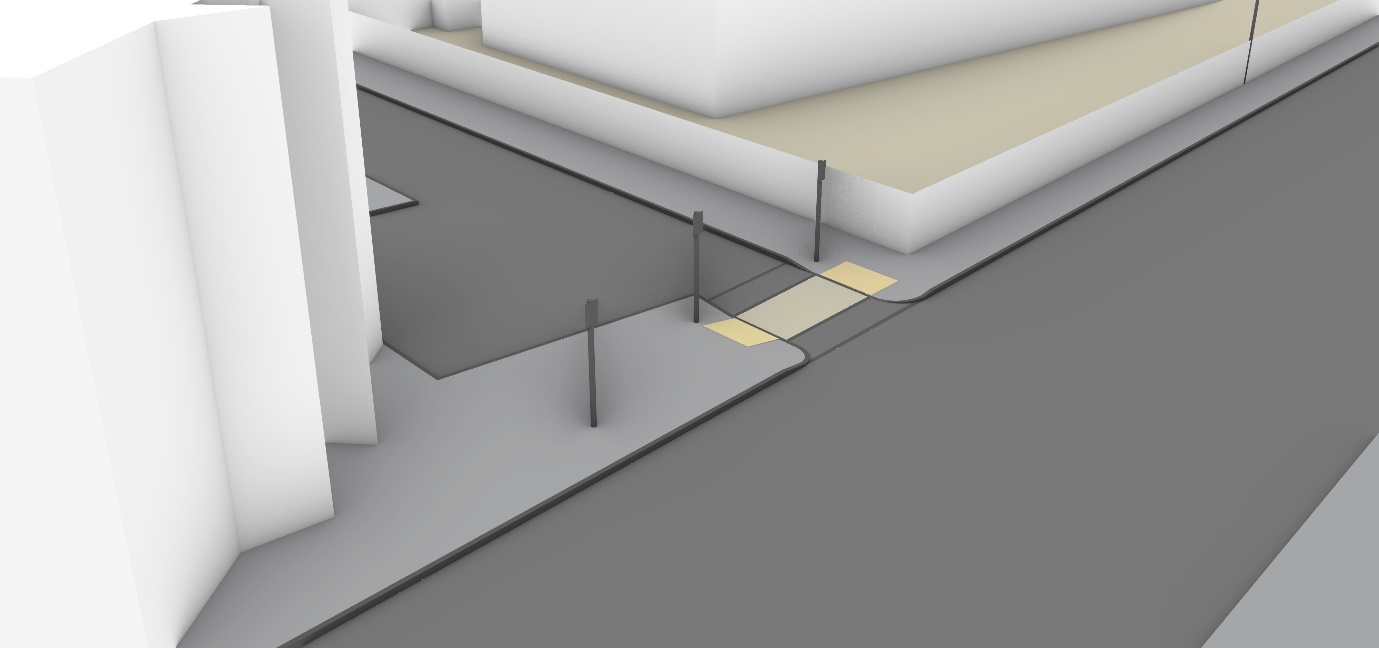
(3D model includes data © Crown copyright 2023, OS 100046668)
Looking toward junction (pedestrian view)

Looking toward junction (pedestrian view)

Looking toward junction (exiting driver’s view)

Detail of surfacing and tactile paving


Background mapping © Crown copyright 2023, OS 100046668
This site was chosen for its unusual “side road entry treatment” design, not because an attempt has been made to convincingly continue the footway.
The location is in the centre of Edinburgh, although somewhat “off the beaten path”.
Nearby and on Chalmers Steet are key city hospital/health/dentistry related buildings, and a secondary school. There are also relatively high-density residential buildings.
Chalmers Street carries two-way traffic, but the street ends 80m to the south of this location (for motor vehicles), at the entrance to a key city centre park (which includes a key city cycle route). Simpson Loan only allows exiting traffic (although appears otherwise to be a two-way street).
The footway in the area is visually distinct from the carriageway (in materials, colour and tone). There is a specially surfaced strip marking the area pedestrians walk across the carriageway, with the same colour as the footway (although with a different material/construction).
There is no ramp encountered by drivers exiting Simpson Loan. There are dropped kerbs, marked with standard blister-style tactile paving, from footway to carriageway level.
There were moderate levels of pedestrian and vehicle use here (9-134 pedestrians per hour, 9-87 vehicles per hour during observation hours 07:00-19:00).
Several drivers were observed ignoring the one-way restriction, entering Simpson Loan.
In broad terms pedestrians seem to treat this as a standard junction – frequently showing that they expected drivers to take priority (NB: this is a subjective judgement as we did not objectively analyse standard junctions, but we can see that at these behaviour varies considerably between individuals and locations, and as traffic characteristics change).
There were an unusual number of cyclists observed cycling the “wrong” way (into the side street, ignoring the no-entry restriction at the mouth of the junction) after travelling north up Chalmers Street from the park. Almost all exiting cyclists turned south toward the park. It seems clear that this route is on a desire line for cycling both to and from the park.
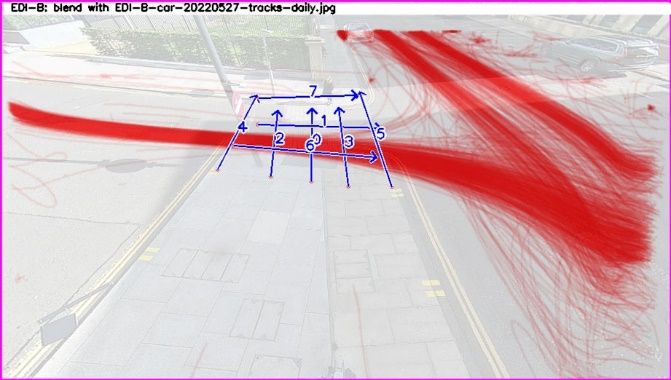
NB: Artificial intelligence identification of vehicle types include errors. Individual lines may be misleading.
Images show that there is a relatively high level of traffic travelling to and from the south end of Chalmers Street, given that this is a dead end. On our site visits we observed that at times Chalmers Street was heavily used for parking and waiting vehicles (sometimes with vehicles stopped in the main carriageway because all parking spots were taken).
These path traces appear to show a higher number of people cycling (blue) on the footway here, but these traces record three days of activity and in reality this was rarely observed. It can be seen that the route to and from the park (away from the camera), and in and out of Simpson Loan (to the left) is a desire line.
It can be seen that most pedestrians are travelling in and out of Simpson Loan, and to and from the park at the south end of Chalmers Street (mirroring the main route used by people cycling).
Background image

Cars (all exiting the side road)
Bicycles

Pedestrians

(at junction with Kirkstall Road)

(3D model includes data © Crown copyright 2023, OS 100046668)
Looking toward junction (approximating driver’s view)
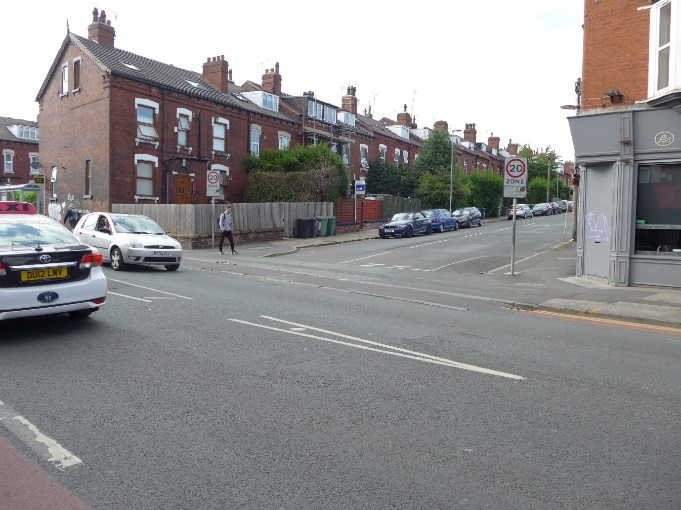
Looking toward junction (pedestrian/cyclist’s view

Junction in distance (exiting driver’s view)
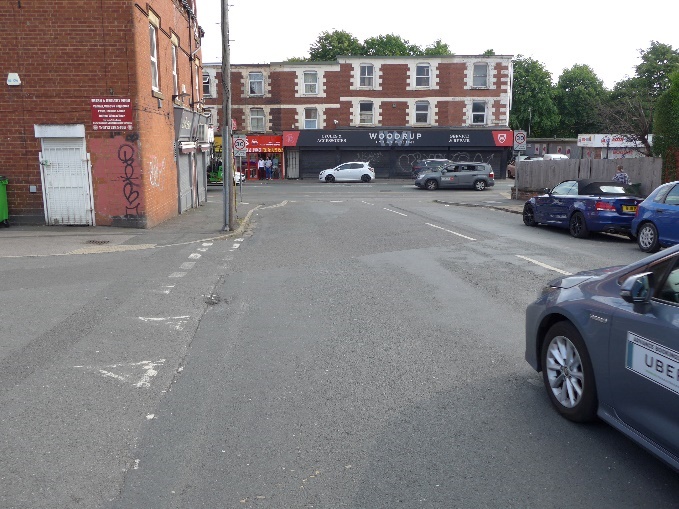
Looking toward junction (pedestrian’s view)

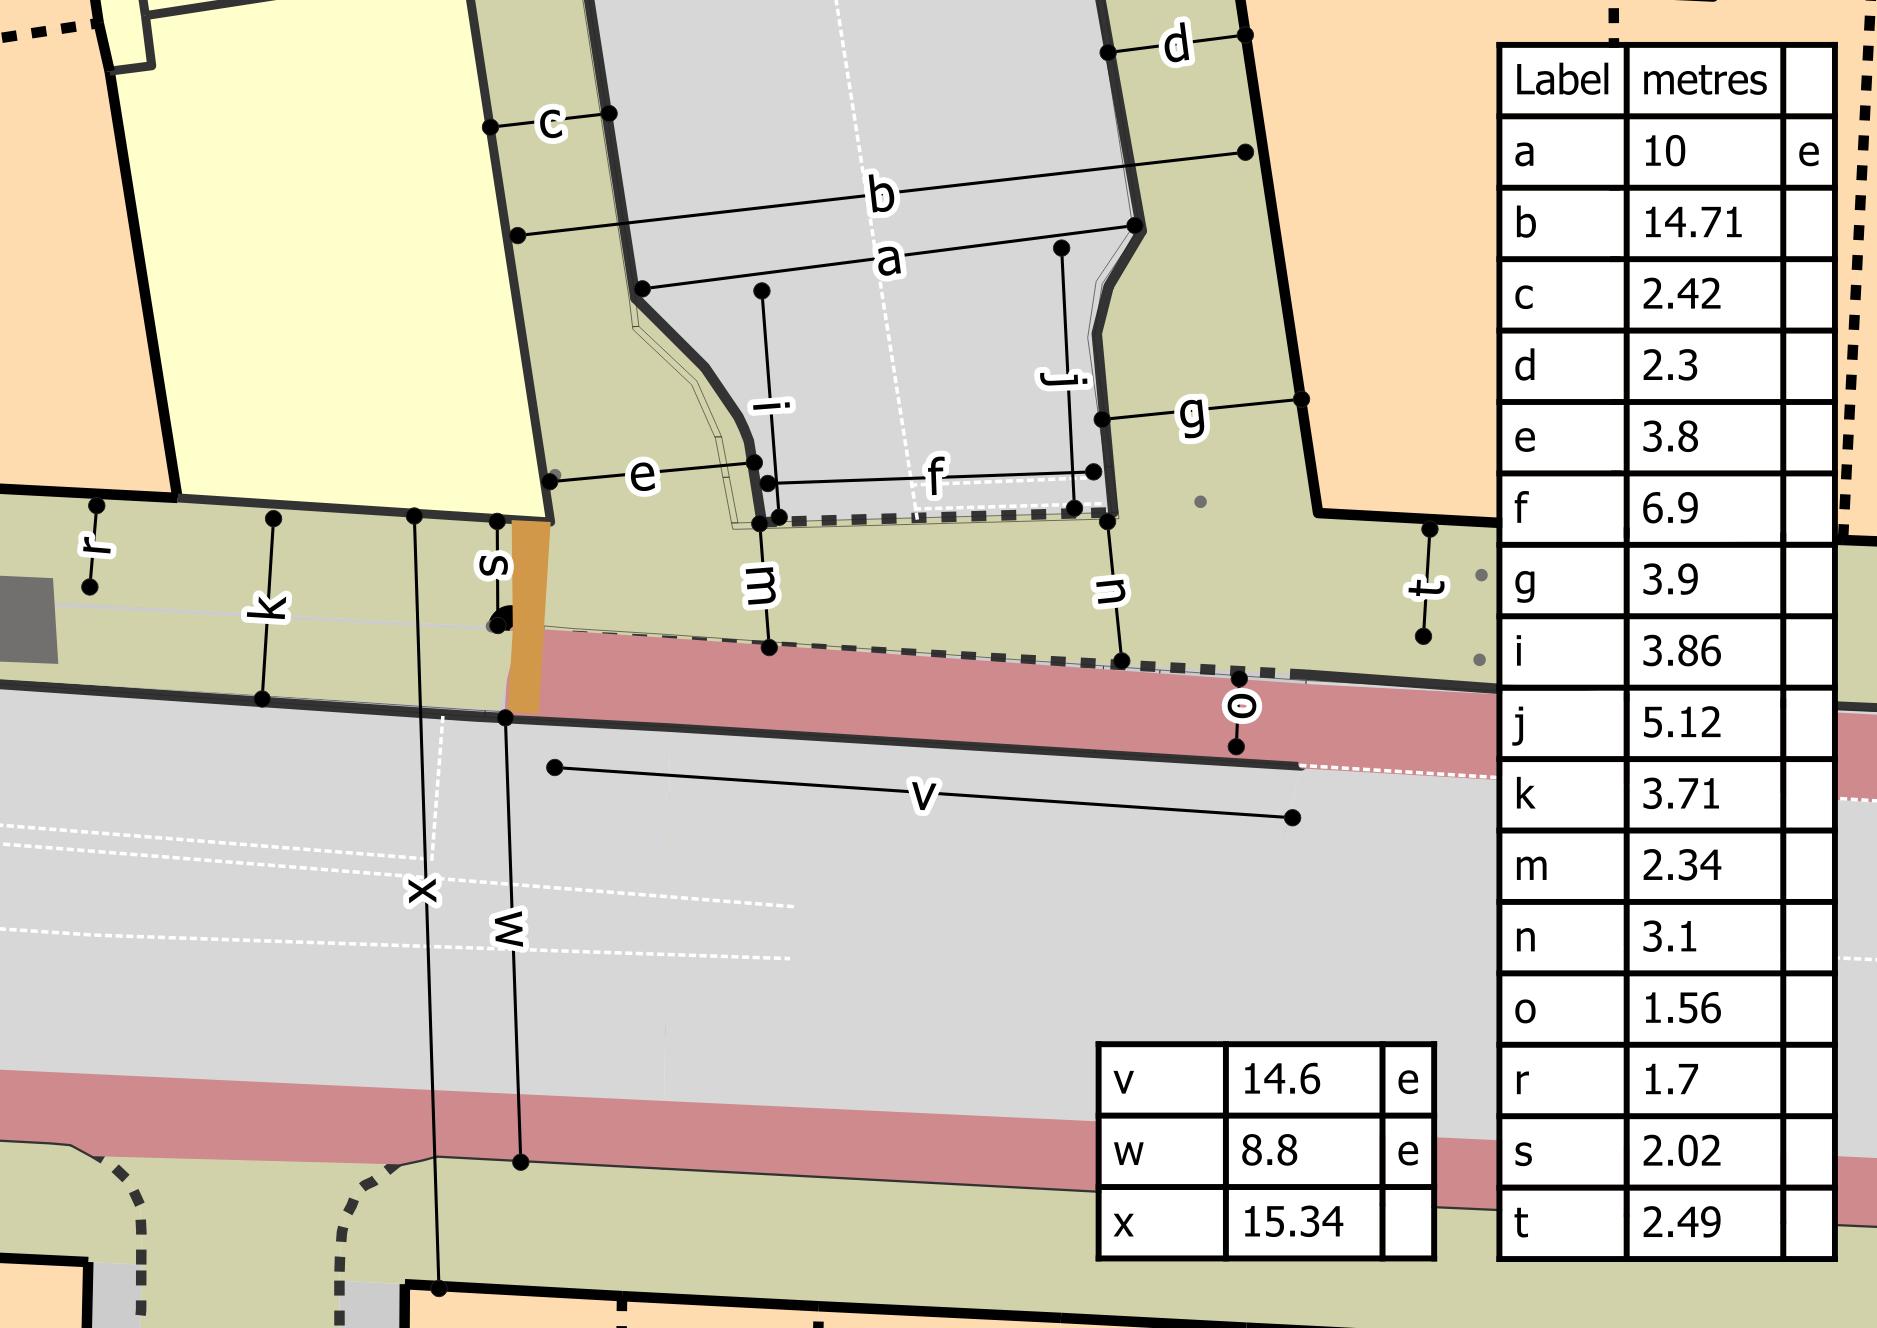
‘e’ indicates estimated dimension Background mapping © Crown copyright 2023, OS 100046668
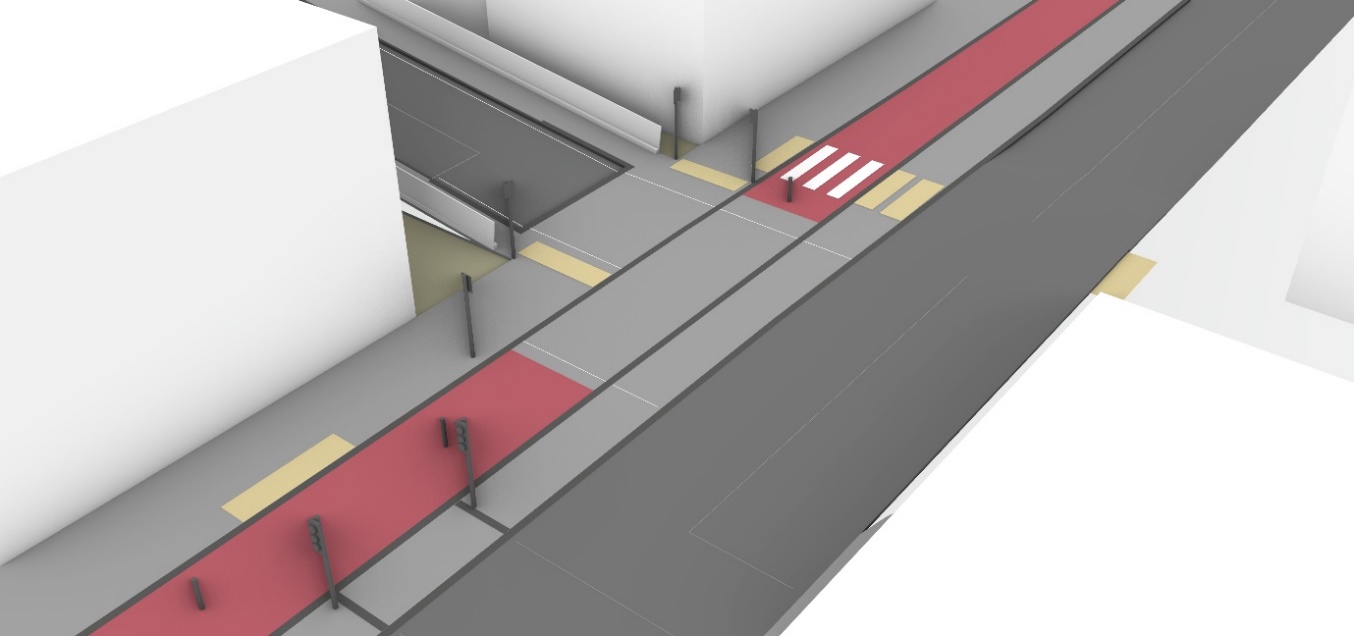
The space, marked in red on the plan, for cycling, is a cycle track at the junction mouth, but is a painted cycle lane elsewhere in this image (to the right and bottom of the plan).
‘e’ in the final column of the measurement table indicates an estimate (often based on Ordnance Survey mapping data) rather than an on-site measurement.
‘r’ is space between a bus stop shelter and the building. ‘t’ is the gap between a pole and the building line.
Kirkstall Road appears to provide a key route for vehicles travelling northwest/southeast in this part of Leeds. It is part of the A65, which in places nearby is a dual carriageway, with three vehicle lanes provided in each direction.
Haddon Road carries two-way traffic.
Many buildings to this side of Kirkstall Road are residential. There is a café on the corner of Haddon Road and Kirkstall Road (with outdoor seating used at times). There is a line of shops facing Kirkstall Road to the southeast – on both sides of Kirkstall Road.
The main carriageway (Kirkstall Road), at Haddon Road, has a traffic lane in either direction. In places there is a cycle track on the northeast side of the carriageway, supporting cycling toward the city centre. This track is of a “stepped” design in places. In some places the track leads cyclists into a cycle lane, as is the case immediately after it passes the junction. Just before the track passes the junction it ceases, inviting cyclists to continue on the footway behind a bus shelter (a gap of around 1.7 metres in which waiting passengers also stand).
In the plan (above) this cycle track and lane are marked in red – but in reality markings for the lane are minimal in most places, and the track is of grey asphalt (matching the footway and carriageway).
There is no ramp marking the edges of the drivable space, and in effect this is flush with the carriageway surfaces. At this point the cycle track (which starts and ends immediately on either side of the junction) is also flush with the carriageway. The key visual indicator that the footway continues is the continuation of the kerb line – with the light-grey colour of these contrasting with the dark-grey asphalt.
Haddon Road had the highest number of vehicles crossing (the drivable space) of all of the detailed-study sites (a peak of 220 vehicles in an hour). Even in the quietest hour studied the number of vehicles crossing here (128) was higher than at the busy times seen at most other sites. The traffic volume on Kirkstall Road was very high, varying between 1344 and 1603 in an hour during the hours studied (07:00-19:00) – with large numbers of buses (up to 28 in an hour) and “trucks” (up to 86 in an hour).
Haddon Road carries a high number of vehicles. Kirkstall Road is a major route for vehicles. The combination means that there were many instances of vehicles queuing to exit Haddon Road. We also observed drivers waiting for gaps in traffic for relatively long periods, taking an opportunity to move when it came. Sometimes congestion on Kirkstall Road meant that speeds were low enough to allow drivers to cooperate in this regard, but at other times drivers could be seen to take an opportunity to exploit a small gap in traffic.
Our researchers found some of their interactions with traffic here (and at Greenhow Road which is parallel to Haddon Road, with an equivalent design) to be challenging. The biggest problems arose when trying to negotiate exiting vehicles (queuing) while at the same time anticipating incoming vehicles – which could peel off the flow on Kirkstall Road, or be sitting waiting for an opportunity to cut across this (right turn in).
While on occasion we observed polite driving pedestrians are not prioritised here in any meaningful sense.
NB: Artificial intelligence identification of vehicle types include errors. Individual lines may be misleading.
The high number of vehicles driving in and out of Haddon Road is apparent (red). The width of the junction means it is easy to see the main paths taken by those undertaking different manoeuvres. It can be seen that the level surfaces allow vehicle drivers to take swept paths through the junction.
It can be seen that most cyclists are on the cycle track (moving toward the camera). There is also some use of the footway here, often away from the camera. We assume that this is because of the level of difficulty involved in crossing to the other side of Kirkstall Road, and the absence of any cycle track for that direction of travel.
Background image

Cars

Bicycles (mostly toward camera on track)

Pedestrians

(at junction with Kirkstall Road)

(3D model includes data © Crown copyright 2023, OS 100046668)
Looking toward junction (driver’s view)
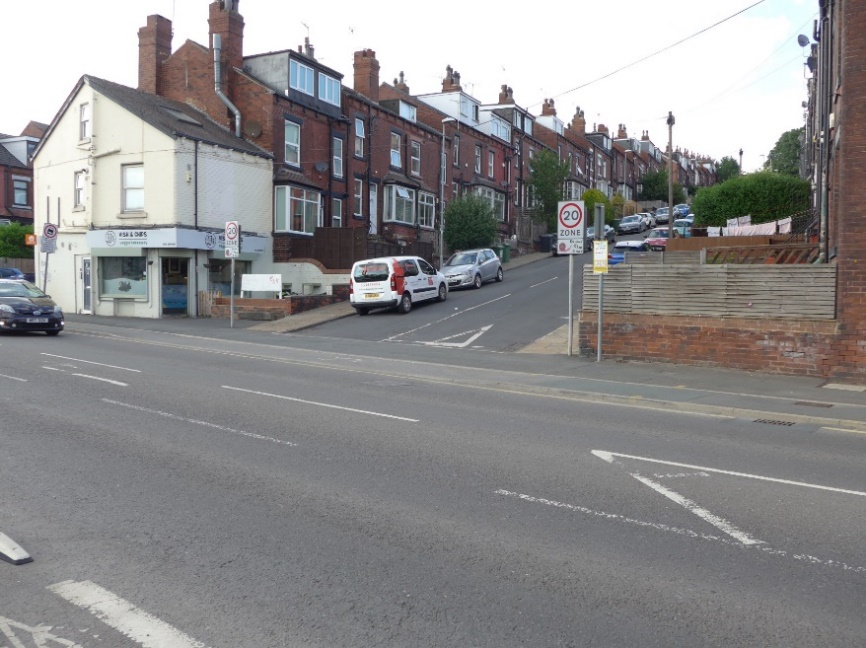
Looking toward junction (pedestrian view)
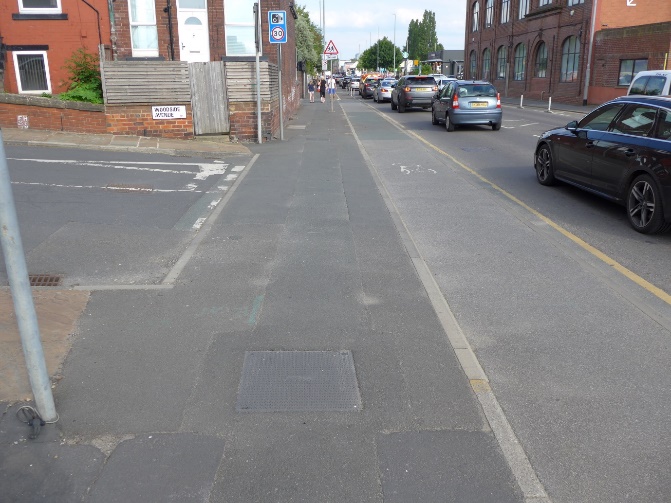
Looking toward junction (pedestrian view)
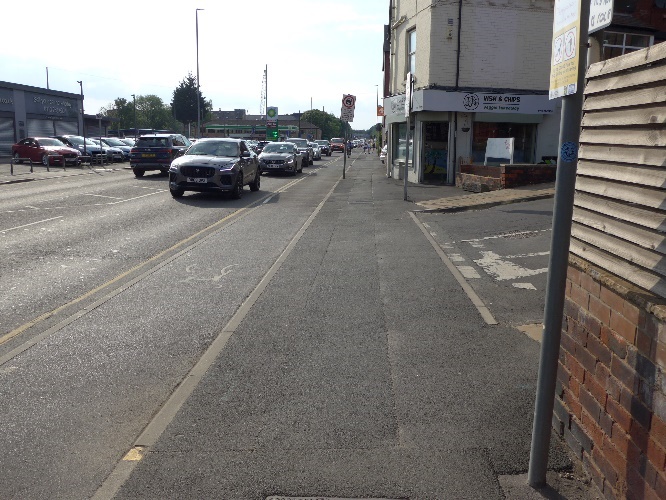
Looking toward junction (driver’s view)

‘e’ in table indicates estimated dimension Background mapping © Crown copyright 2023, OS 100046668
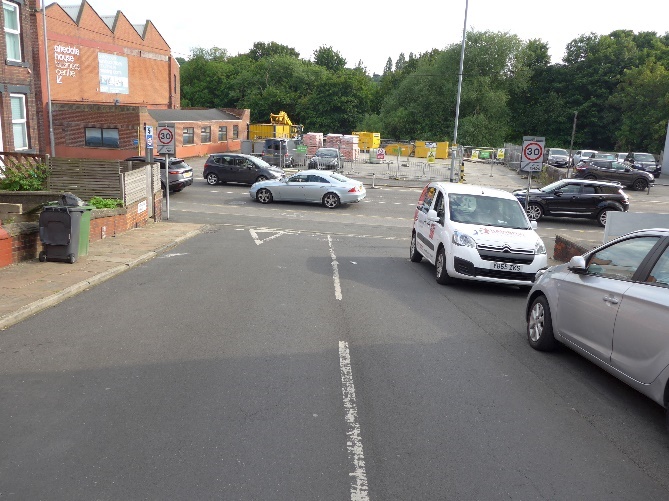
This site is around 300m northwest of the Haddon Road site. The design of the continuous footway is similar. Refer to the Haddon Road description for comments on traffic on Kirkstall Road, and for descriptions of its design.
Unlike at Haddon Road, the “stepped” cycle track here is continuous, and free of obstructions. There is, however, very little physical separation between cycle track and footway. Although a kerb provides a drop in level to the track, this is only of a minimal height (and this height difference is insignificant at the drivable space).
Woodside Avenue carries a very low level of traffic – fewer than 20 vehicles in any study hour (cars and vans).
Woodside Avenue has low levels of vehicle use. There are parked vehicles on Woodside Avenue, narrowing the carriageway, and probably limiting vehicle speeds here.
The parked vehicles on Woodside Avenue block the visibility of/for pedestrians, meaning that it is sometimes necessary to step onto the drivable space before being able to see clearly whether vehicles are approaching from the side road.
The incline on Woodside Avenue (down toward Kirkstall Road) produces an effect much like had a ramp been present – for exiting vehicles as they encounter the drivable space. The effects of this on entering vehicles are less relevant as these do not encounter the incline (upwards) until they finish crossing the drivable space.
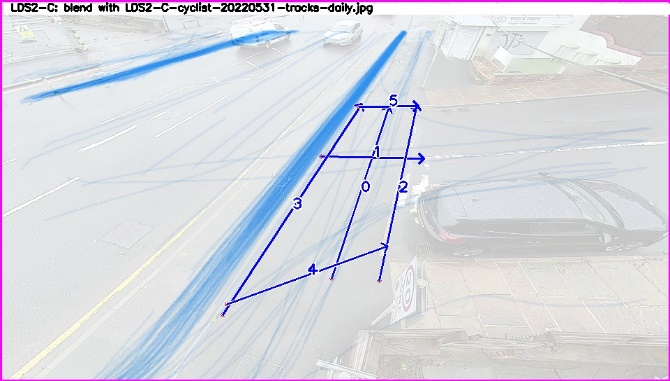
NB: Artificial intelligence identification of vehicle types include errors. Individual lines may be misleading.
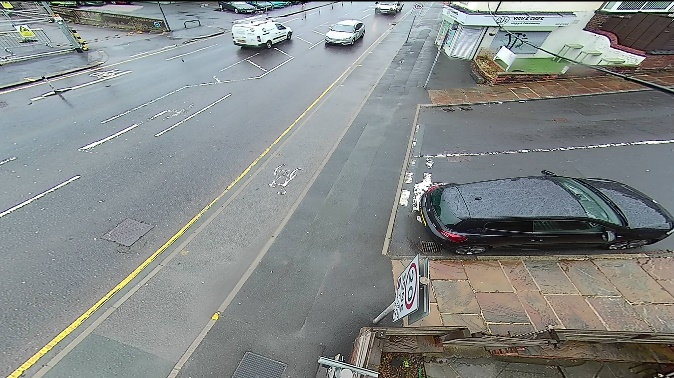
It can be seen that a very much lower number of vehicles (red) uses Woodside Avenue when compared to the images of Haddon Road (both being at junctions with Kirkstall Road).
Most cyclists (blue) can be seen to be in the cycle track, but small levels of cycling on the pavement are also apparent. As at Haddon Road, this may be because of the difficulty involved in crossing Kirkstall Road.
Background image
Cars

Bicycles
Pedestrians

(at junction with Guilford Street)
(3D model includes data © Crown copyright 2023, OS 100046668)
Looking toward junction / into side road
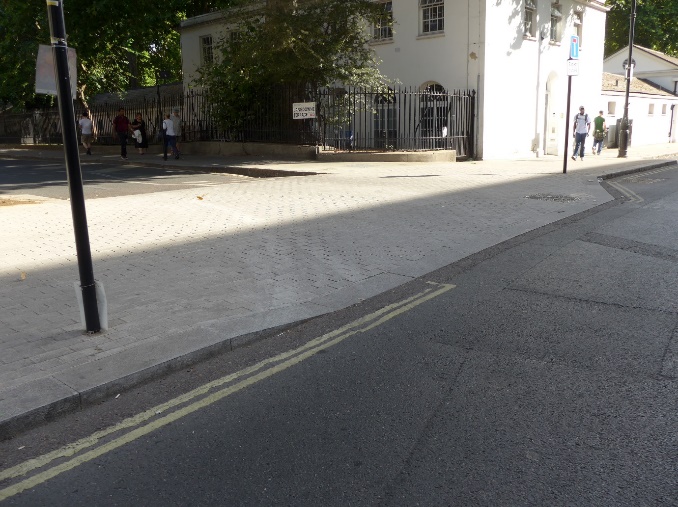
Looking toward junction (pedestrian view)
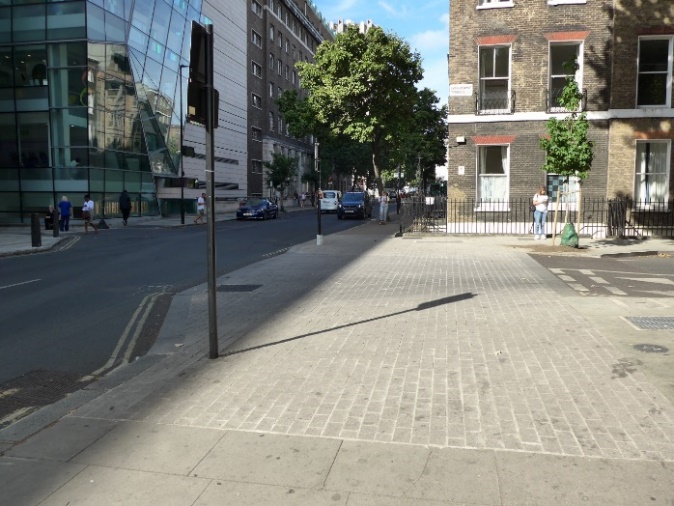
Looking toward junction (pedestrian view)
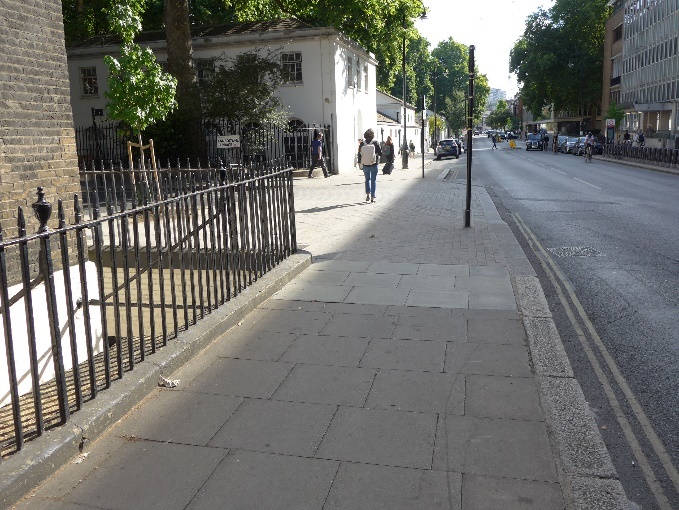
Looking toward junction (exiting driver’s view)


‘e’ in table indicates estimated dimension Background mapping © Crown copyright 2023, OS 100046668
‘Q’ is the dimension between a wall and a lamppost (beside ‘L’). ‘C’ is a length of straight kerb, whereas ‘S’ is the length (i.e. in the direction driven) of the adjacent ramp. ‘R’ is the approximate equivalent ramp length (in the direction driven) beside the main carriageway.
This is an inner-London location. There are many residential-style properties in the area, but also office style blocks. Whether the “residential” properties were used for residential purposes was not investigated.
Guilford Street carries two-way traffic, although does not appear to be a major route. Lansdowne Road is a cul-de-sac for motor vehicles, but a through road for cycling.
The continuous footway is of a noticeably different colour to the asphalt carriageways. There are gentle ramps lifting vehicles and bicycles to footway height (although beside the main carriageway it is the drivable space which slopes – rather than a distinct ramp – over around three metres).
There is a high level of cycling here, but primarily across the footway and to/from the east, rather than along Guilford Street (51 in an hour - 229 in an hour – 07:00-19:00). There are a low number of vehicles crossing the footway (1-20 in an hour).
Most of the “vehicles” crossing the drivable space are bicycles. There are high levels of pedestrian use here, but the majority of pedestrians (as the majority of those cycling) are walking in and out of Lansdowne Terrace (often, as with cycling, to and from the east) rather than on a journey past this along Guilford Street.
Most interaction between people cycling and pedestrians is of a complex nature, with each person accommodating the progress of the other – usually through small changes in direction. Pedestrian movement is relatively complex, with crossing movements common in all directions – including diagonally on Lansdowne Terrace and across Guilford Street.
NB: Individual lines may be misleading.
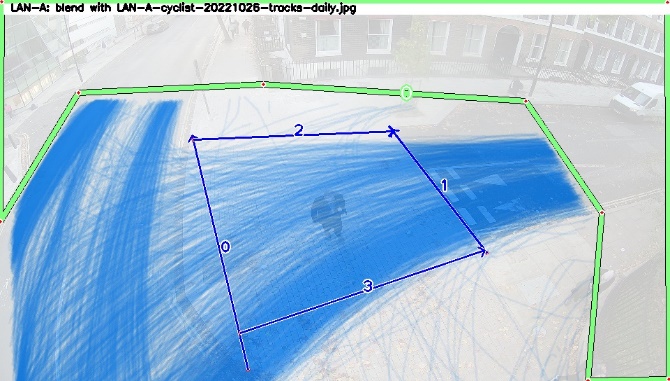
It can be seen that there is very little use of Lansdowne Terrace by car (red).
There are a very high number of cyclists here (blue), and that a high proportion are entering and leaving Lansdowne Terrace from the east. Almost all people are cycling on the carriageway here.
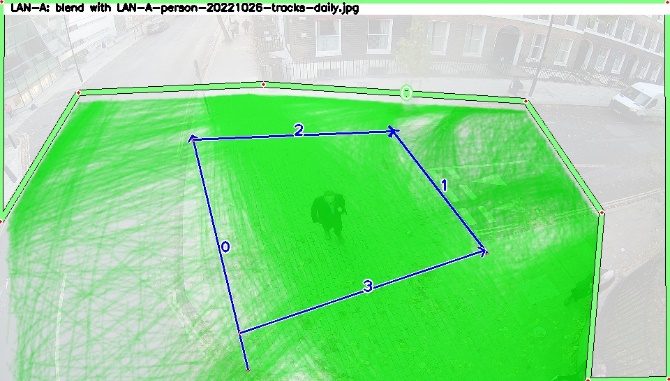
Pedestrians (green) can be seen to be taking a variety of routes here. A high number were walking in and out of Lansdowne Terrace, some crossing the road end as they did so (often using both the drivable space and walking on the side road carriageway).
Background image
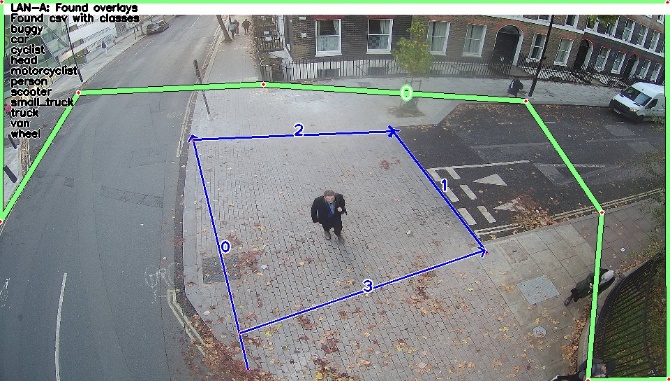
Cars

Bicycles
Pedestrians
(at junction with Bancroft Road)

(3D model includes data © Crown copyright 2023, OS 100046668)
Looking toward junction (driver’s view)
Looking toward junction (pedestrian’s view)
View for pedestrian exiting side road

View for driver exiting side road

‘e’ in table indicates estimated dimension Background mapping © Crown copyright 2023, OS 100046668
‘D’ is a measurement of kerb orientation/length. ‘T’ is the distance between a ramped area and the end of the parking area marked (with paint).
Alderney Road is in London (London Borough of Tower Hamlets). Both the “main” road (Bancroft Road) and Alderney Road appear to be primarily of a residential character, but to the east side of Bancroft Road here is an NHS site (Mile End hospital).
Both roads carry two-way traffic, and there is little sense that Alderney Road is of any less significance for traffic movement than Bancroft Road. Traffic levels across the drivable space were close to those seen at Haddon Road in Leeds.
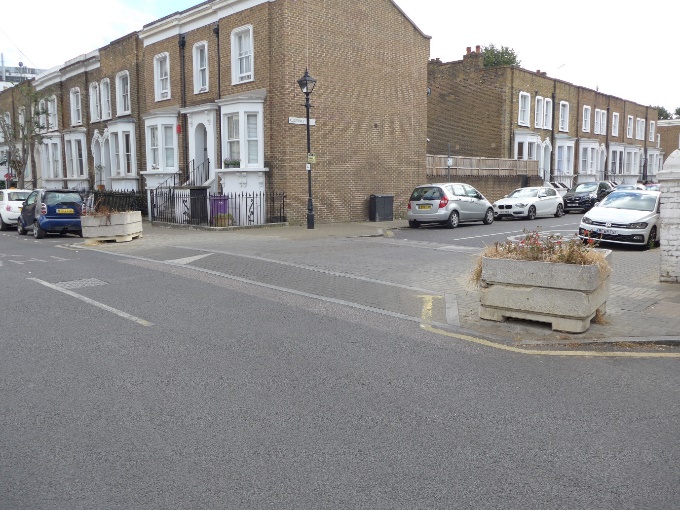
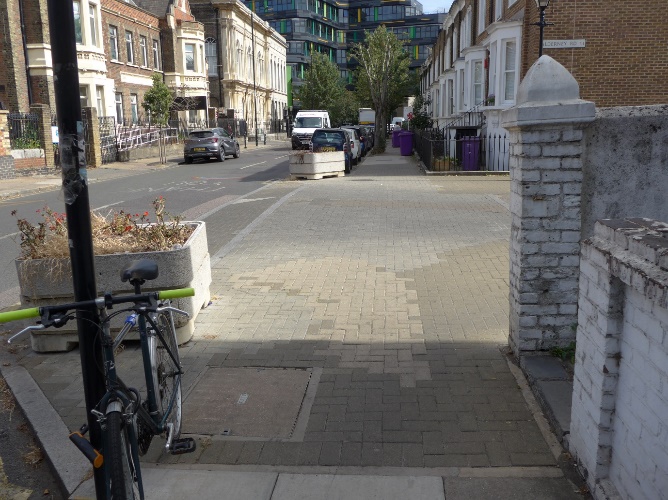
In some ways the drivable space appears to be part of the footway. It is at footway height, and is surfaced with blocks, as are parts of the main footway. However these blocks vary in colour, and other parts of the footway are surfaced with asphalt or larger flags. Although when new the blocks at the drivable space may have appeared much lighter than the carriageway asphalt, they currently appear to be of much the same colour, not least through discolouration from vehicle tyres.
This site has build-outs, both into the main and side road carriageways, as described in the main report.
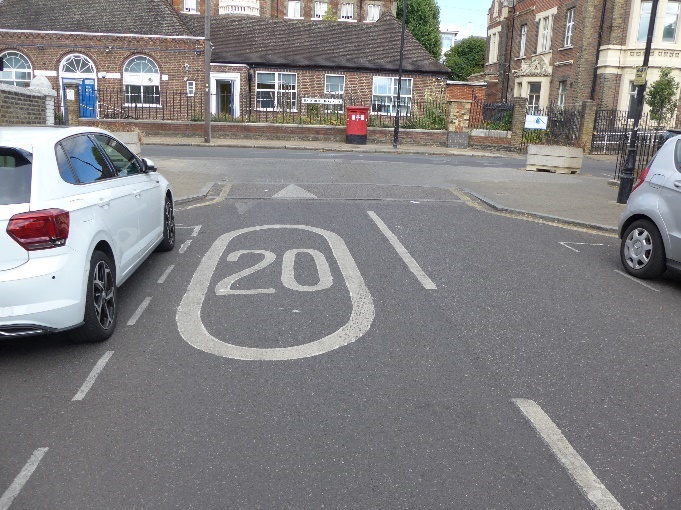
There are no give-way markings or signs, however the ramps have standard triangular paint markings (one for each direction).
In our structured analysis this site had the second highest level of RLA and PVI flagged pedestrian experiences. It is notable that RLA flagged experiences were not far short of the level at Haddon Road in Leeds – despite the very different designs.
This did not appear to be a “main” road and a “side” road in anything more than the physical sense. There are high levels of traffic travelling in and out of Alderney Road.
Although the amount of traffic crossing the drivable space was reminiscent of the site at Haddon Road, the character of the vehicle movement here was very different. Whereas on Haddon Road queues of exiting traffic caused issues, and vehicles turning in were under pressure, here speeds were lower – but there was also less often a need for a driver to stop to give way to other vehicles. Parked vehicles narrow the available space for driving on Alderney Road, meaning that at busy times speeds are limited as drivers pass one another with care.
Many pedestrians appear to be walking to and from the nearby gate into the hospital – to and from Alderney Road – crossing Bancroft Road in doing so. Many of these pedestrian cross Bancroft Road at the junction. It seems likely that the crossing is facilitated by the build-out into Bancroft Road. This means that the main carriageway here is narrower, and that parked vehicles do not obstruct the crossing.
While complex conditions sometimes arose due to turning-in and turning-out vehicles meeting, these interactions took place at a speed which was limited by the limited space (drivers sometimes waiting for one another).
The ramps may have slowed some vehicles from more extreme speeds, but some vehicle speeds were still high enough to affect pedestrian behaviour.
NB: Artificial intelligence identification of vehicle types include errors. Individual lines may be misleading.
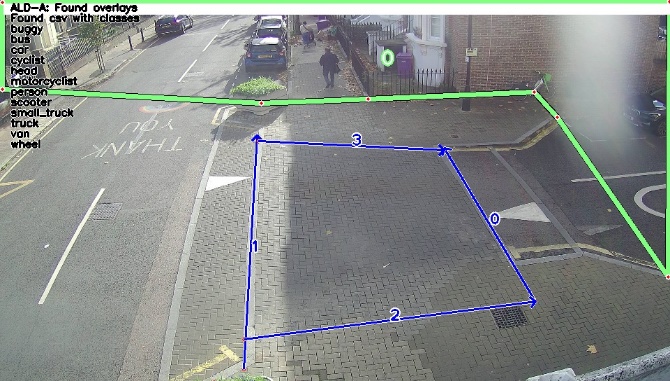
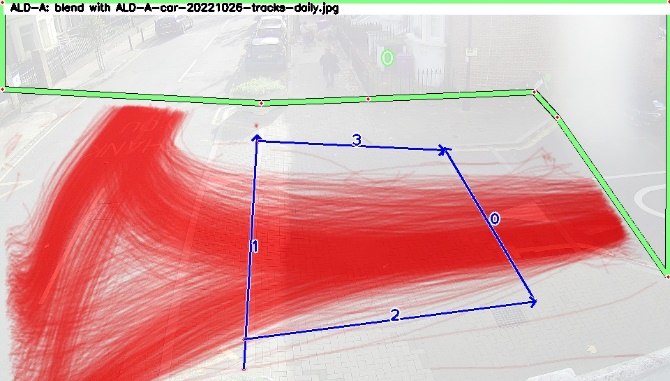
It can be seen that the side road here (Alderney Road) carries as much traffic as the “main” road (Bancroft Road).
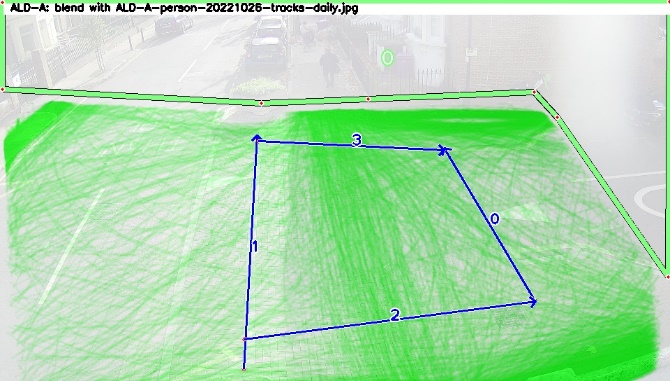
Pedestrian movements (green) are complex, with pedestrians crossing both the side road and the main road in multiple places and directions.
Background image
Cars
Bicycles

Pedestrians
(at junction with Buckingham Gate)
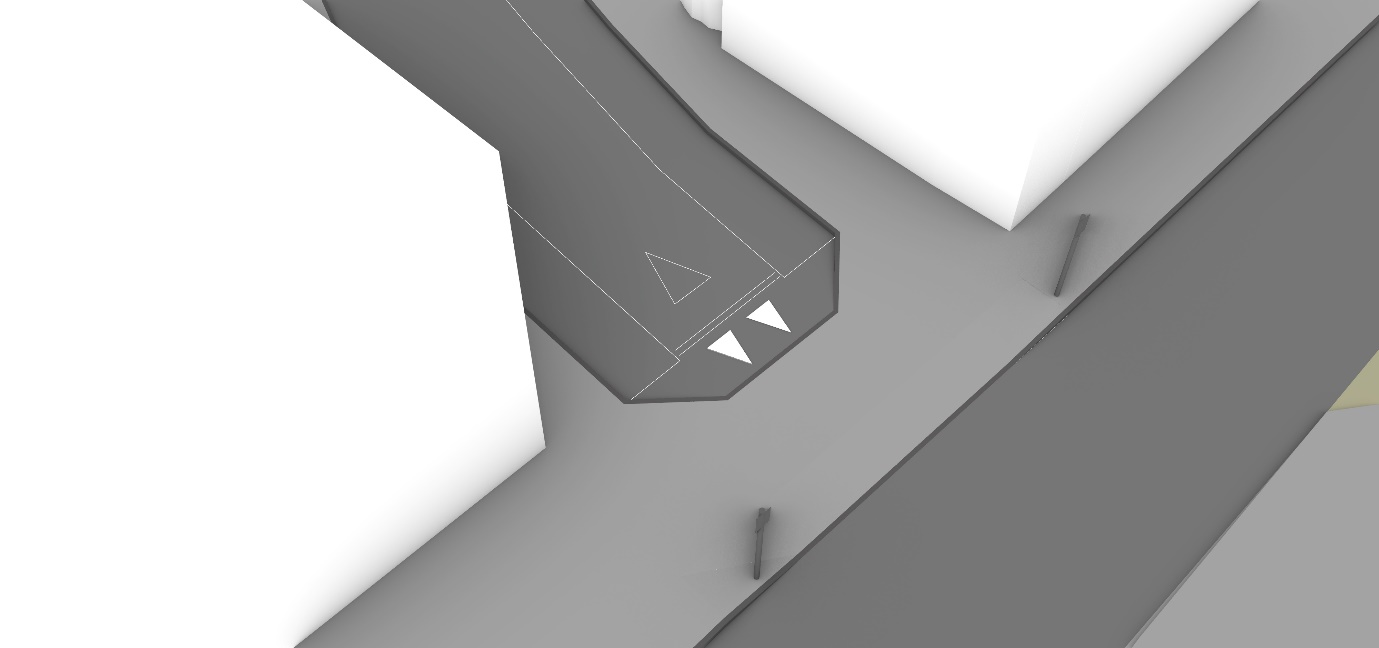
(3D model includes data © Crown copyright 2023, OS 100046668)
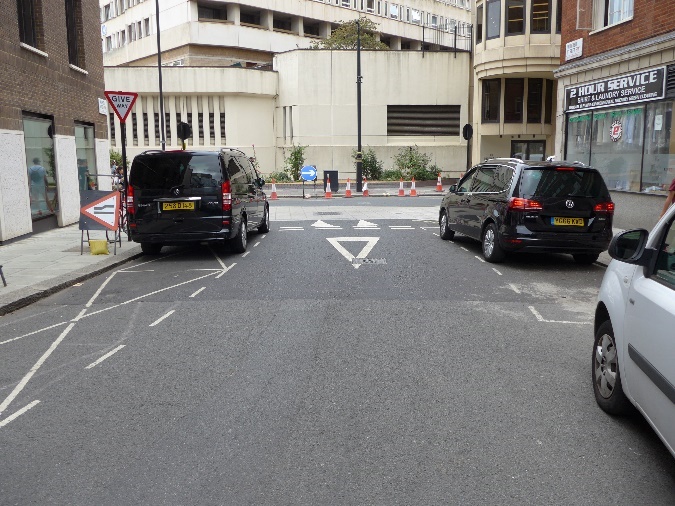
Looking toward junction (pedestrian view)

Looking into side road

View of exiting driver
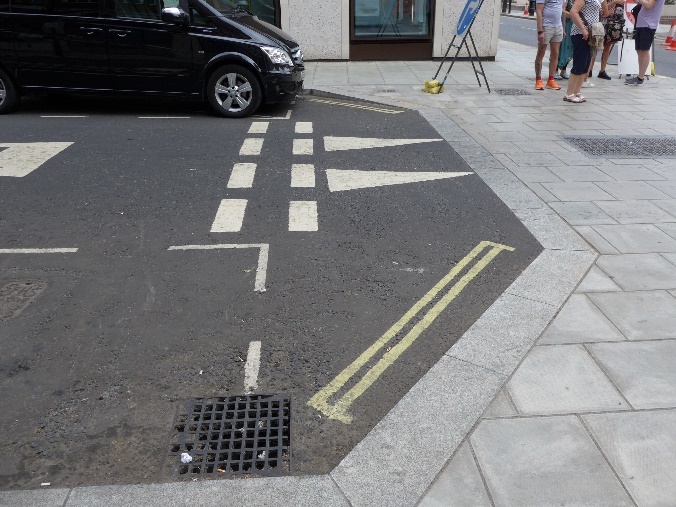
Ramp detail
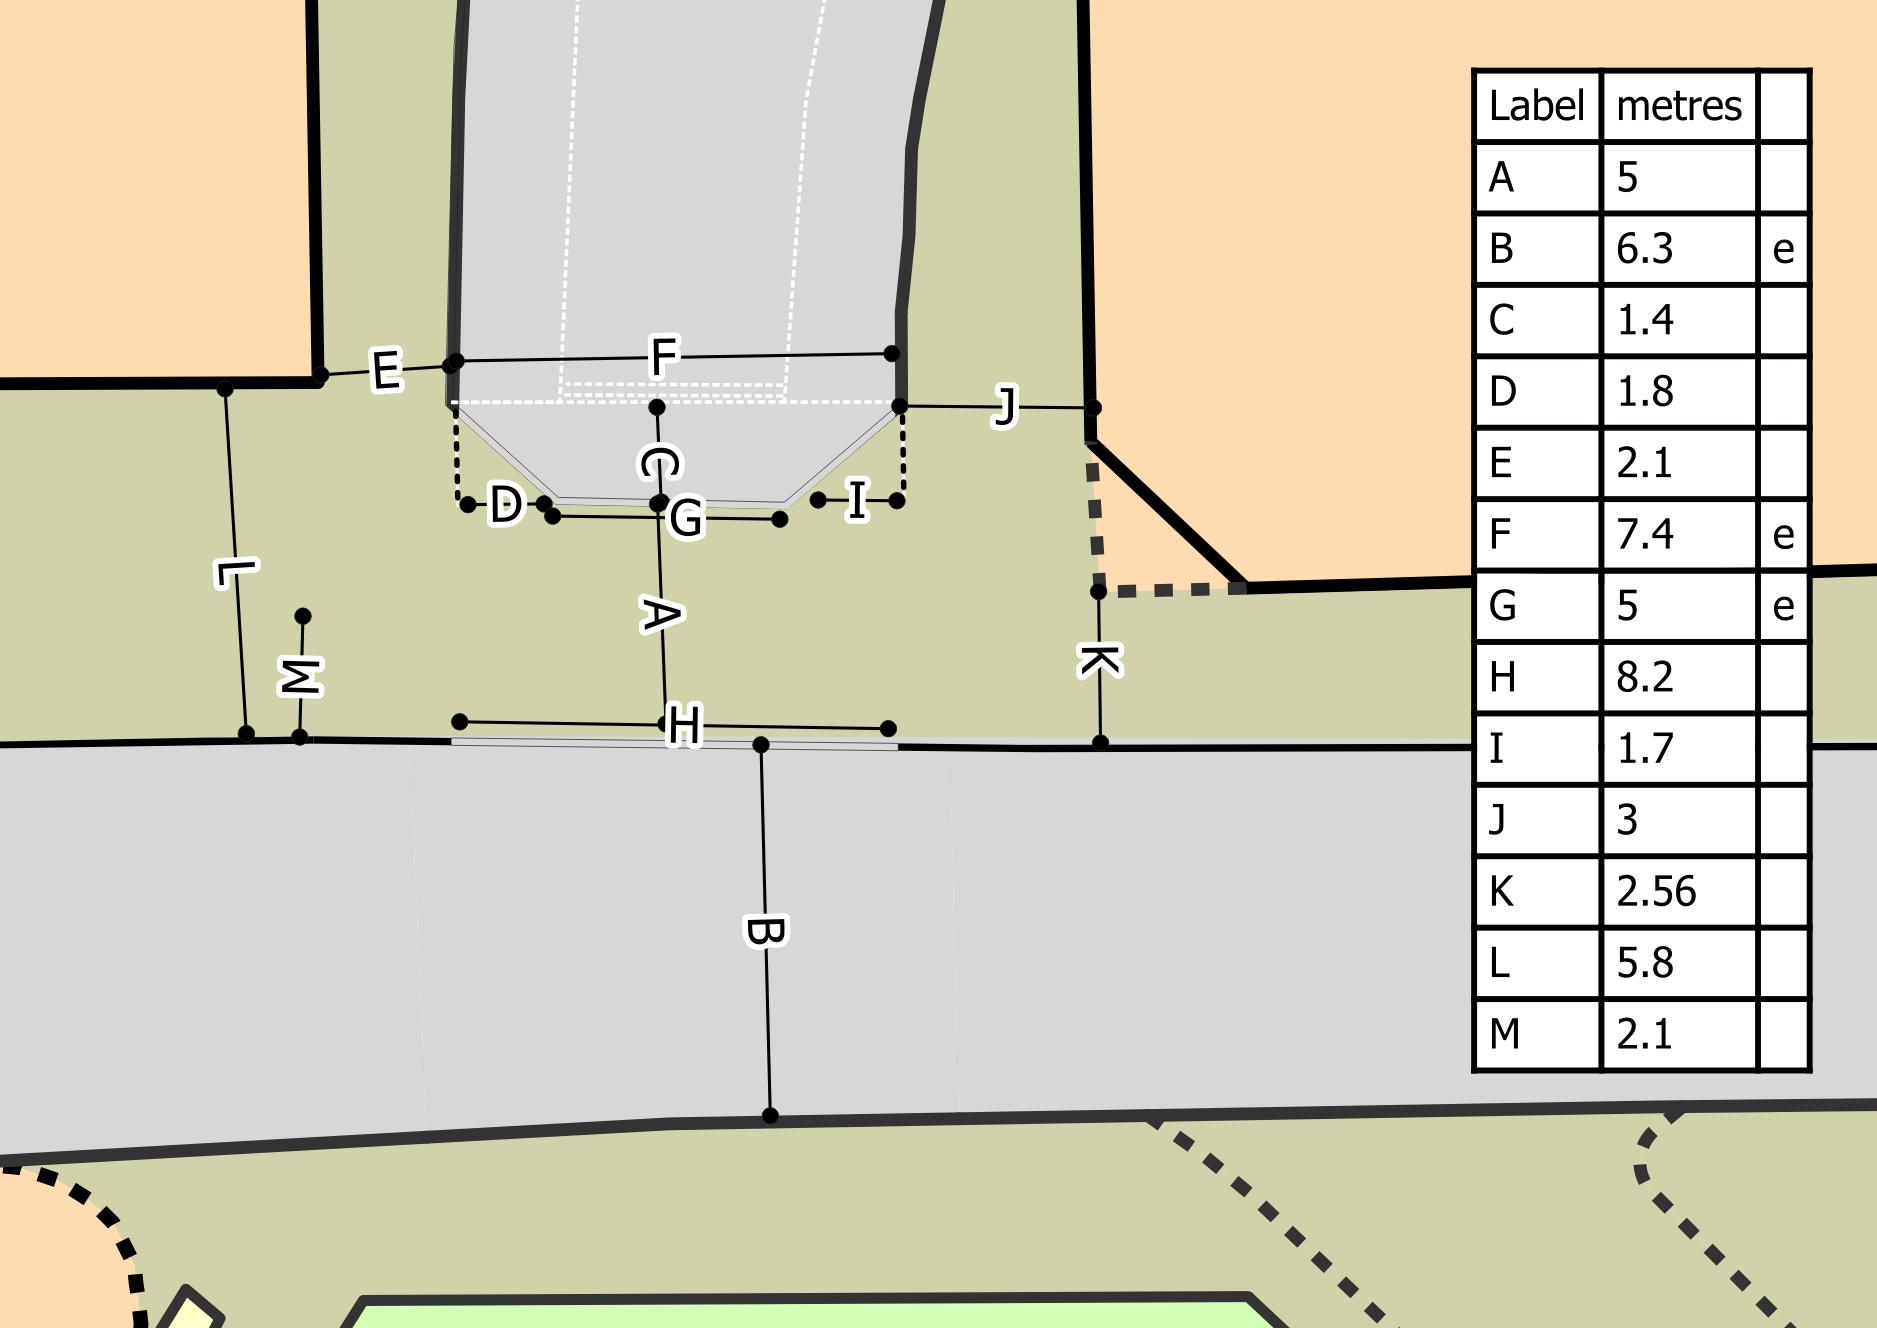
‘e’ indicates estimated dimension Background mapping © Crown copyright 2023, OS 100046668
Dimension ‘M’ is of the ordinary footway, as further along Buckingham Gate. Dimension ‘L’ is across a wider area which appears to be footway, but which seems to be often used for parking a vehicle.
Wilfred Street is in central London (City of Westminster). The area is multi-use, with residential accommodation, offices, shops and restaurants, and so on. The presence of a military barracks, with a building face which lacks obvious larger windows, defines much of one side of Buckingham Gate.
Both Wilfred Street and Buckingham Gate carry only one-way traffic – only exiting vehicles cross the drivable space at the end of Wilfred Street.
The surface of the footway here, and of the drivable space, is of a much lighter colour than the grey asphalt of the carriageway surfaces. The colour of the footway, and the character of the material, is maintained across the drivable space, although there is some noticeable discolouration from vehicle tyres.
There is a gentle (insignificant) ramp to the side road carriageway, but none to the main carriageway. From the pedestrian perspective, the footway height drops only a little, and gently.
There is an issue here with the visibility of/for pedestrians, caused by parked vehicles at the side road end. Although in the plan view above there is some sense that the drivable space is narrowed by the equivalent of build-out spaces, these are effectively part of the drivable space. There are no obstructions to use of the whole space by vehicles, and vehicles can be parked right up to the edge of this space.
This issue was at its most acute when a delivery lorry was present (see image below), however it remained a problem at other times.
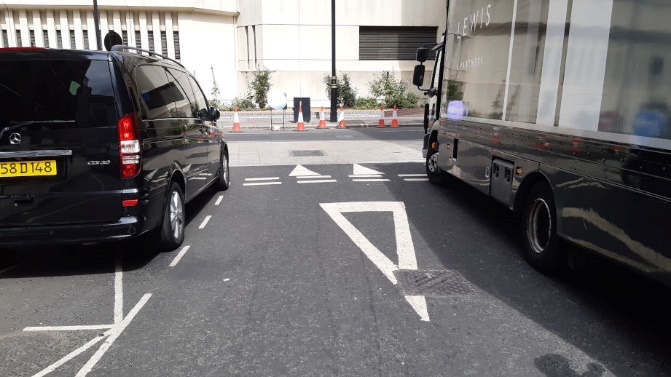

The drivable space is, however, wide enough (i.e. the distance between side road carriageway and main carriageway surfaces is high enough), so that most pedestrians are crossing this away from the side road ramp, reducing the issues somewhat.
Vehicle speeds on Wilfred Street are sufficiently low to noticeably add to pedestrian comfort, but the visibility issues mean that some were seen reacting quite suddenly to unexpected oncoming vehicles. Drivers often had established their own priority with their speed at the actual junction, which remained high enough to affect pedestrian behaviours, by the time the people involved could see one another. The gentle ramp here appears to have an insignificant effect.
On occasions when several vehicles were following each other out of the end of Wilfred Street, the impression was of behaviours at a standard road end.
We did not carry out a survey with fixed cameras at this site.
(at junction with Cowbridge Road East)
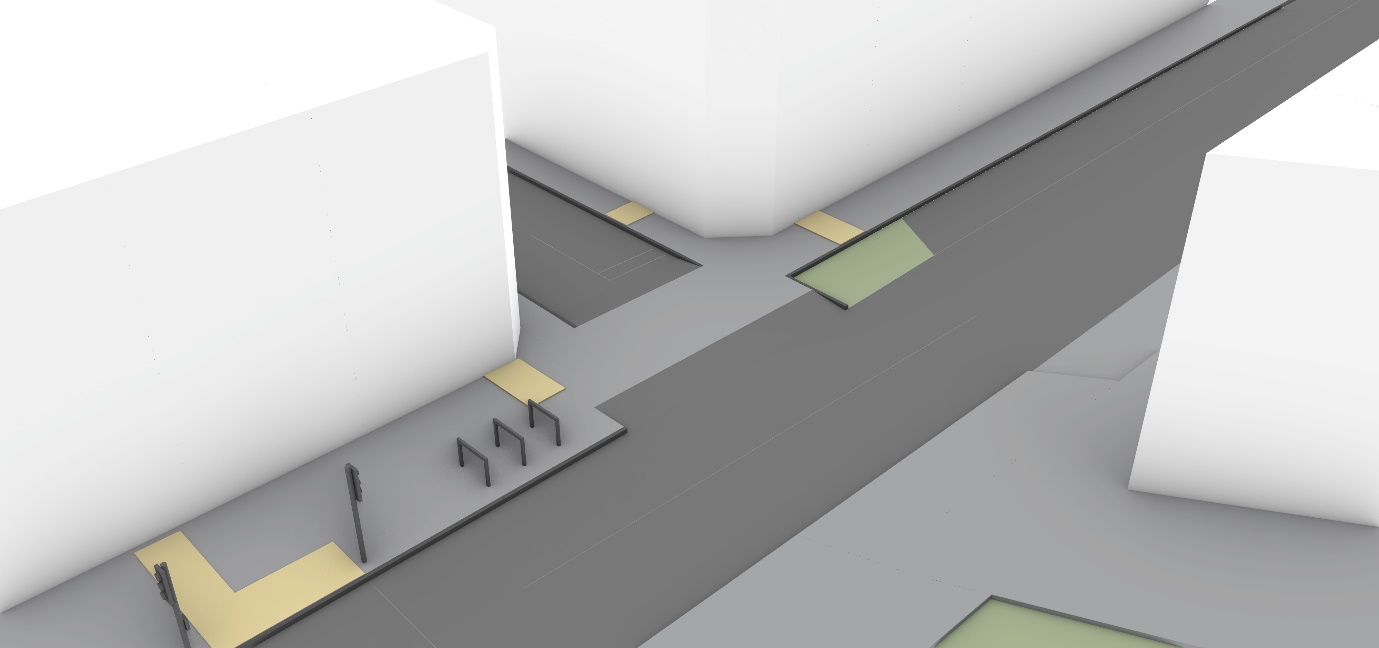
(3D model includes data © Crown copyright 2023, OS 100046668)
Looking towards junction/into side road

Looking toward junction (pedestrian view)
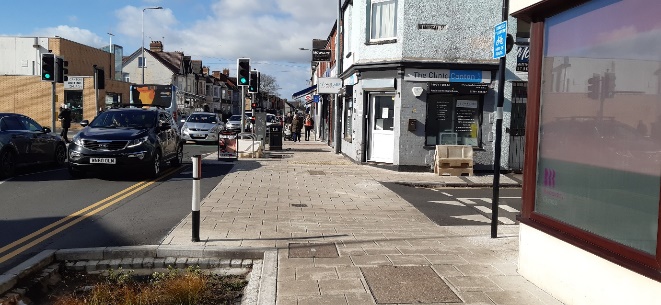
Looking toward junction from side road (pedestrian view)

Ramp detail

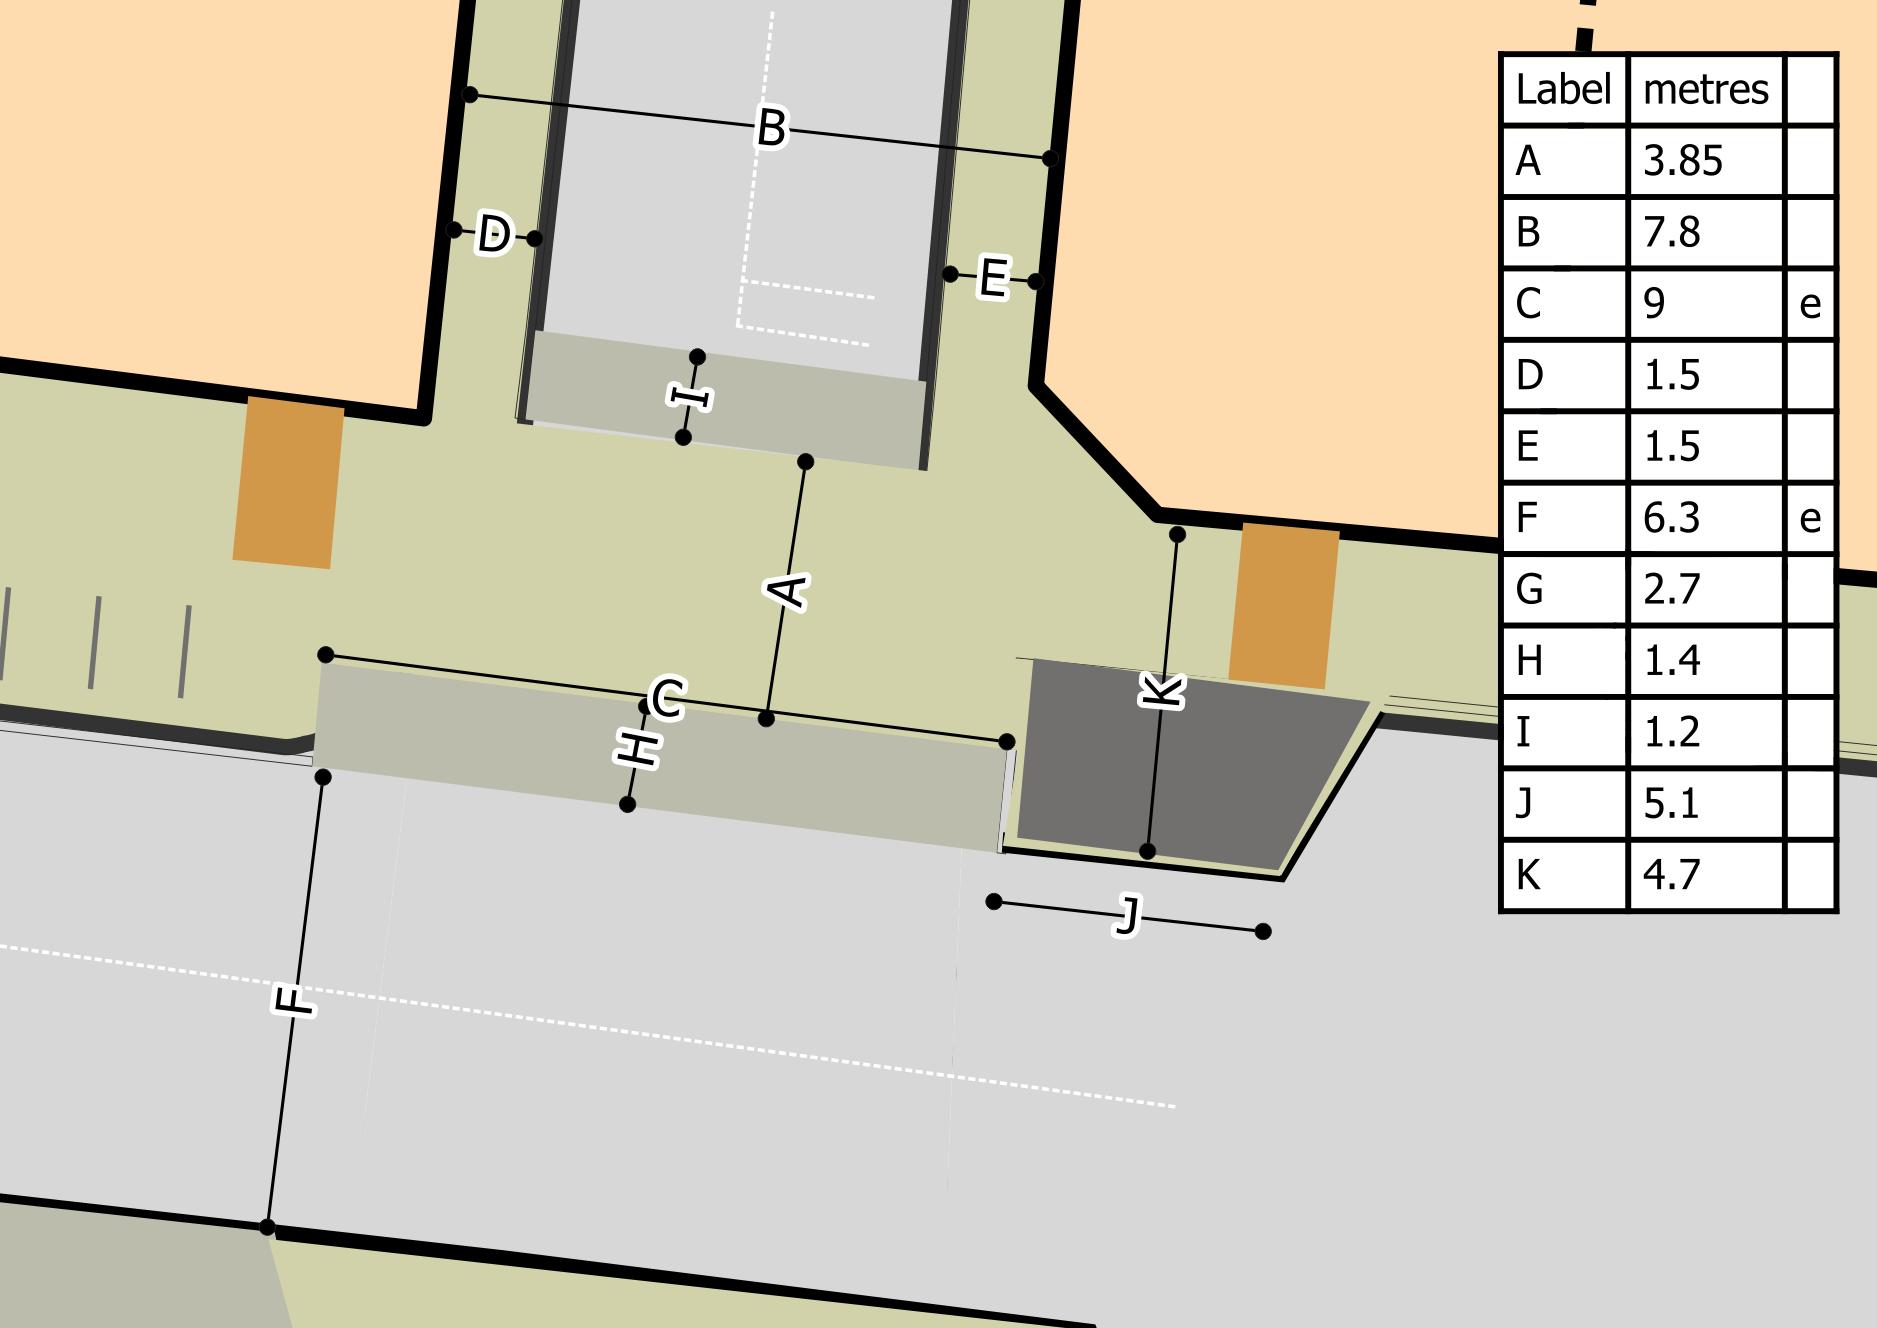

‘e’ indicates estimated dimension Background mapping © Crown copyright 2023, OS 100046668
Glamorgan Street appears to function, in effect, as a car park access for vehicles. There are, however, pedestrian routes through this car park area into a primarily residential area.
Cowbridge Road East appears to provide a key east-west driving route. This section divides at either end from the A4161, which might be expected to carry most of the east-west traffic, but there appears to be little to physically distinguish one as being more significant for driving than the other.
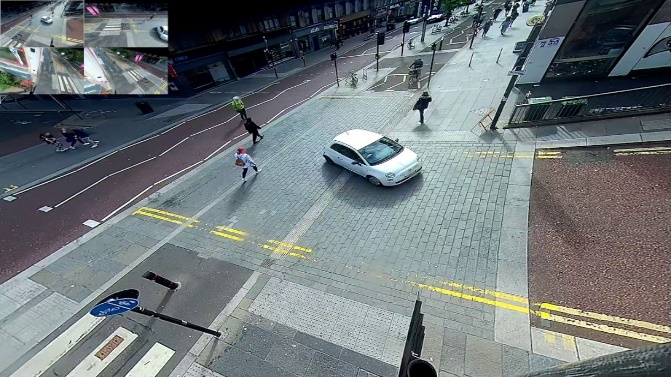
At this point Cowbridge Road East has shops and restaurants (and similar establishments) on either side, and it is also used for parking. A supermarket, with its own smaller car park, is on the opposite side of Cowbridge Road East from Glamorgan Street. A signalised crossing (with traffic lights) is provided close to the junction.
The continuous footways here include a build-out feature into the main carriageway.
Glamorgan Street can carries two-way traffic but is narrow enough to limit speeds if vehicles are travelling in both directions.
The surface colour of the footway is maintained across the drivable space and while there is a change of material this is visually insignificant. The footway and carriageway surfaces are of a noticeably contrasting colour (with the carriageway of asphalt).
There are ramps from the carriageway to the drivable space/footway height. These are surfaced with asphalt, thus appearing as part of the carriageway surfaces.
There are “End of Route” and “Rejoin Carriageway” signs nearby, and the signalised crossing is of a Toucan design (allowing cycling across it). Thus it appears that it is intended that cycling is allowed on the footway close to this junction, on either side of the main road, presumably as a means to cross this road more safely using the crossing.
There is restricted visibility for exiting drivers due to the buildings here.
There is no sense that drivers use the give-way lines as an indication of a position to stop their vehicles. When pedestrians are not present drivers appear to assume that they can continue up to the main road carriageway edge – it only being when a pedestrian is seen that any alternative behaviour occurs. This can be when pedestrians are only one or two steps from the drivable space.
For example, we studied the behaviour of 50 drivers exiting Glamorgan Street (mid-morning). None of them stopped at the give-way lines. Four stopped or slowed for pedestrians, and this occurred near or just after the give-way lines – but we concluded that this might be because the lines just happened to be in the place where this would naturally occur. Many gave way to traffic on the main road, but not at the location marked for doing so.
The ramps here may slow extreme speeds, but they are gentle, and some vehicle speeds appear to be high enough to have an effect on pedestrian behaviour.
The narrow width of Glamorgan Street can be seen to slow speeds – including of vehicles turning into this.
NB: Artificial intelligence identification of vehicle types include errors. Individual lines may be misleading.
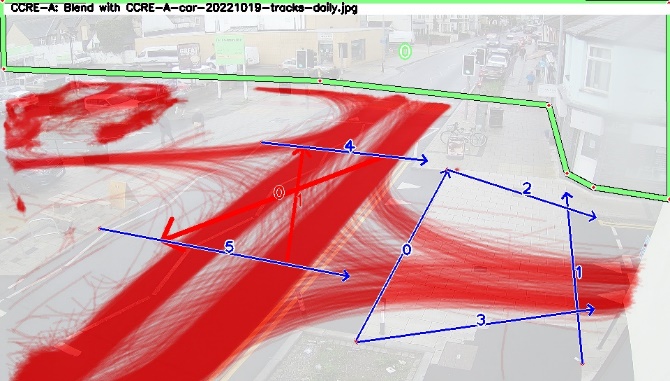
It can be seen that the narrowness of Glamorgan Street, and the build out areas (into the main road) mean that vehicle traffic (red) crossing the drivable space is (broadly) at 90 degrees to the route taken by pedestrians (at the point they intersect).
Most cyclists (blue) use the carriageway, but it can be seen that there is some limited cycling on the footway (also on the opposite side of the main road).
There is a high level of pedestrian use (green), and the signalised crossing and Glamorgan Street itself can be seen to be well used.
Background image

Cars
Bicycles

Pedestrians
